Fig. 3.
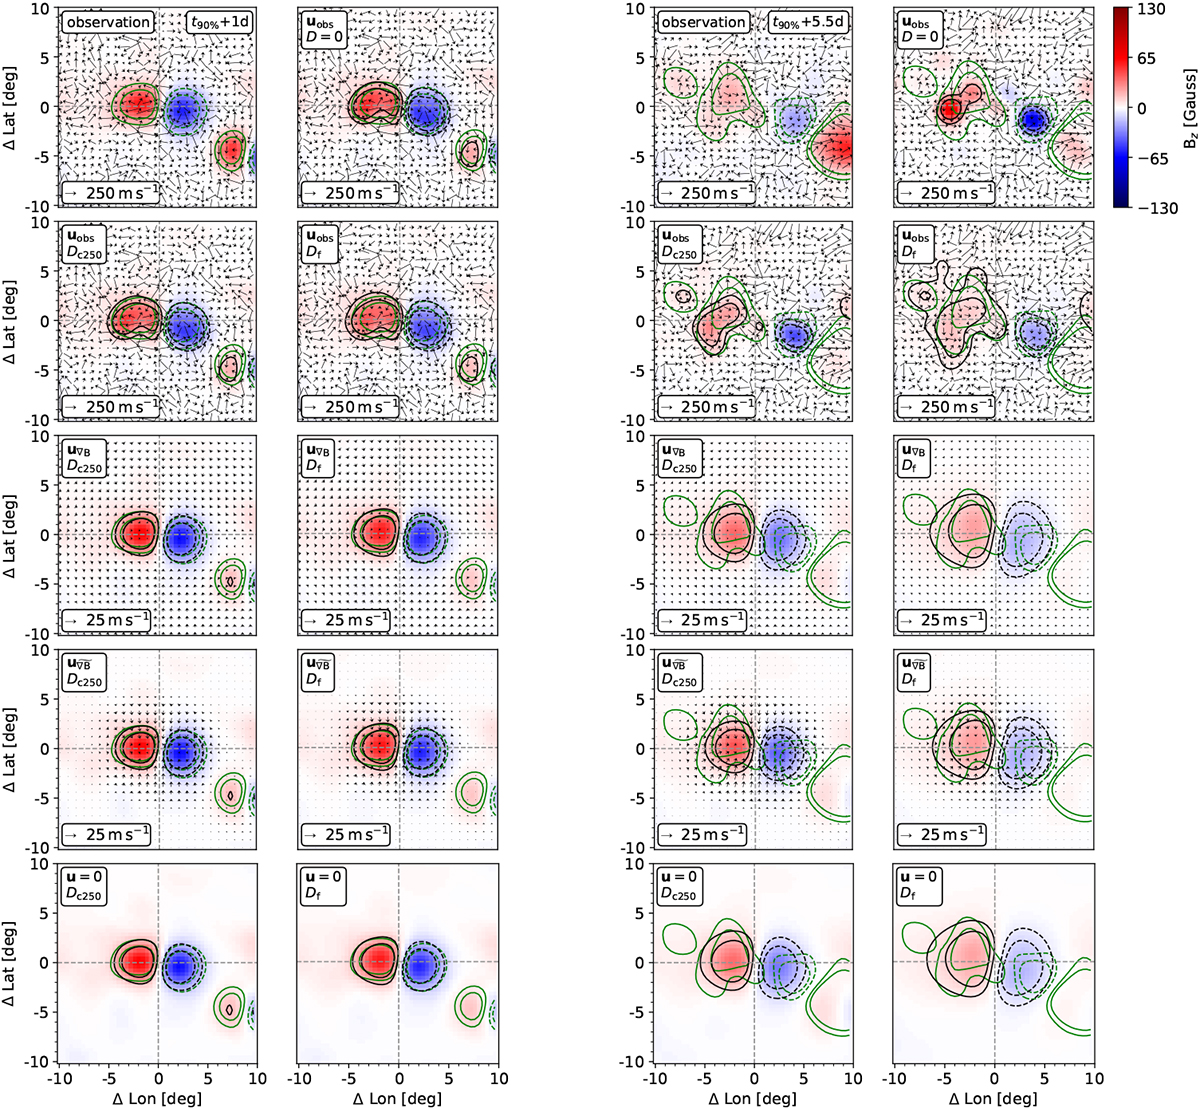
Download original image
Two example time steps of the observations and the simulations for AR 11137. The two columns on the left show the first time step after simulation start, that is, 0.5 days after tstart = t90% + 0.5 days. The two columns on the right show the time step at the end of the simulations, at t90% + 5.5 days. The times are indicated in the upper right corner of the top left panels. At each of the two time steps, the top row shows the observed magnetic field and flows (left) and the simulation using observed flows and no additional diffusion (right). For all other rows, the left (right) panels show simulations with constant (flux-dependent) diffusivity Dc (Df). From the second row to the bottom: observed flows, flows according to the parameterized inflow model, flows according to the modified parameterized inflow model, and no flows. The diffusion in the cases of constant diffusivity is 250 km2 s−1. The arrows indicate the observed and the parameterized flows for the respective observations and simulations. Reference arrows are given in the lower left corners of each panel. Red (blue) indicates positive (negative) radial magnetic field. All maps have the same saturation at ± the rounded maximum absolute field strength in the central 10° from all simulation time steps. The green (black) contours indicate levels of half and a quarter of the minimum and maximum magnetic field in the central 10° of the observation (of each simulation) for each time step individually.
Current usage metrics show cumulative count of Article Views (full-text article views including HTML views, PDF and ePub downloads, according to the available data) and Abstracts Views on Vision4Press platform.
Data correspond to usage on the plateform after 2015. The current usage metrics is available 48-96 hours after online publication and is updated daily on week days.
Initial download of the metrics may take a while.