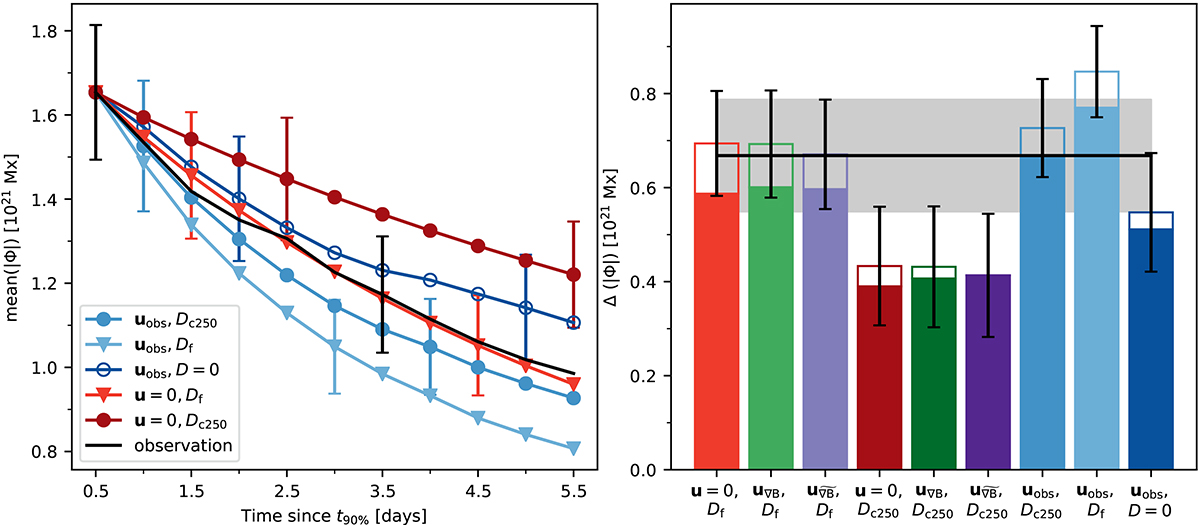
Fig. E.1.
Download original image
Left: Evolution of the total unsigned flux over the central disk with a radius of 5°, averaged over the sample of ARs, for the observations and some of the simulations. The error bars indicate the standard error over the sample. Only every sixth error bar is plotted for readability. The data point at t90% + 0.5 days is the initial condition of the simulations. The diffusion in the simulation with constant diffusivity and no flows is 250 km2s−1. Right: Amount of flux loss between the last time step of the simulations, at t90% + 5.5 days, and the time when the simulations were initialized, at t90% + 0.5 days. The black line indicates the flux loss in the observations over the same period, and the gray shaded area indicates the standard error. The solid and contoured bars indicate flux loss due to cancellation and advection, respectively.
Current usage metrics show cumulative count of Article Views (full-text article views including HTML views, PDF and ePub downloads, according to the available data) and Abstracts Views on Vision4Press platform.
Data correspond to usage on the plateform after 2015. The current usage metrics is available 48-96 hours after online publication and is updated daily on week days.
Initial download of the metrics may take a while.