Open Access
Fig. 1.
Download original image
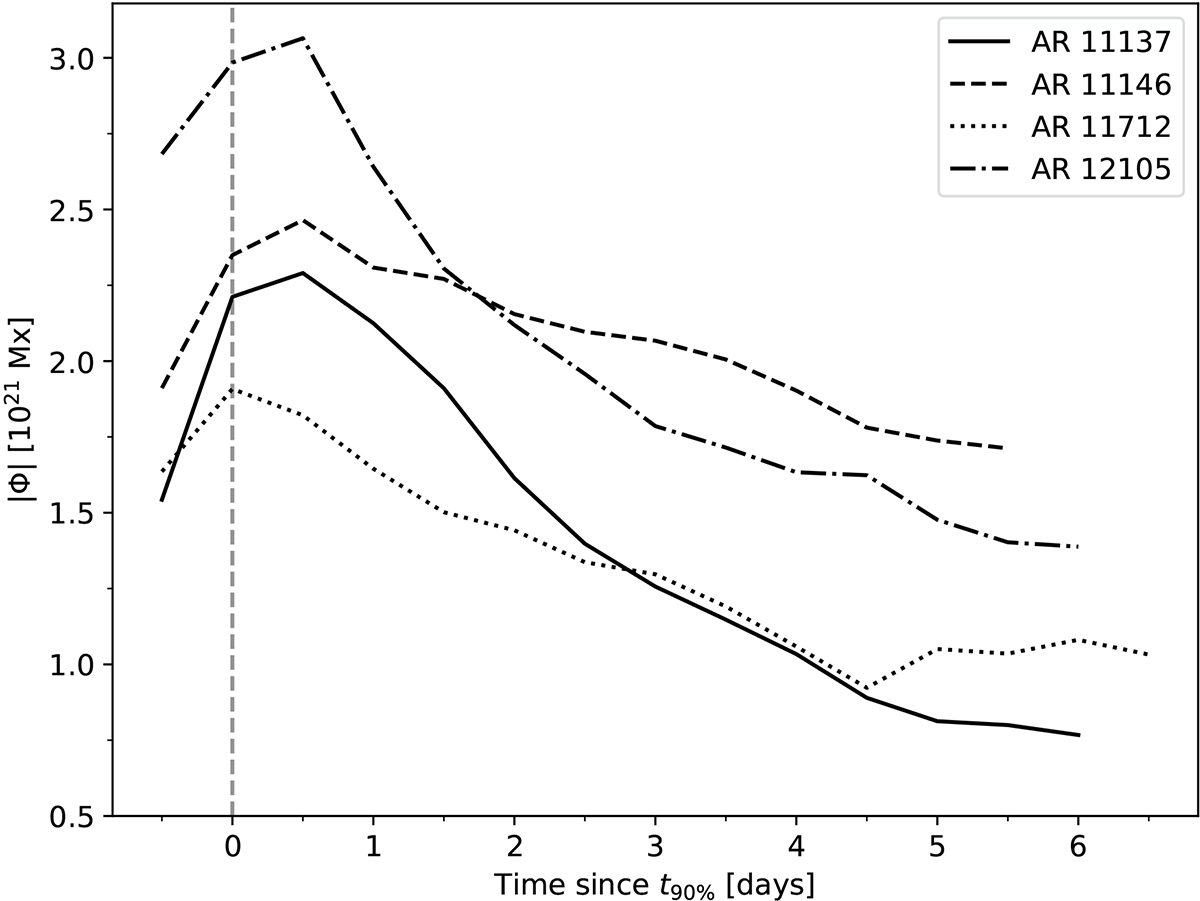
Evolution of the total unsigned magnetic flux of four ARs, calculated from twelve-hour averages of the μ-corrected line-of-sight magnetograms. The ARs are aligned in time relative to the time t90% at which 90% of the maximum flux has emerged. In one of the shown examples, this coincides with the time of peak flux.
Current usage metrics show cumulative count of Article Views (full-text article views including HTML views, PDF and ePub downloads, according to the available data) and Abstracts Views on Vision4Press platform.
Data correspond to usage on the plateform after 2015. The current usage metrics is available 48-96 hours after online publication and is updated daily on week days.
Initial download of the metrics may take a while.