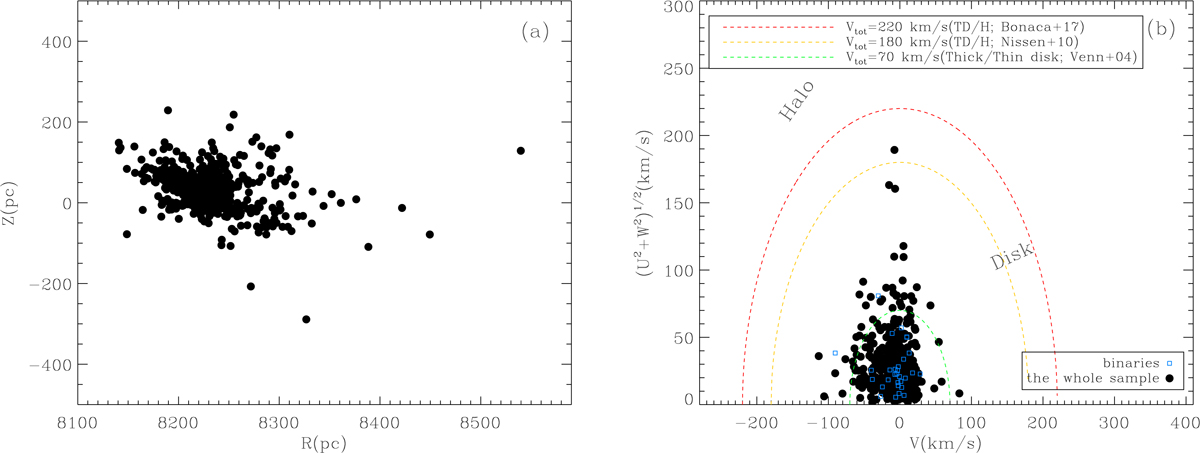
Fig. 8.
Download original image
Galactic R versus Z diagram (a). Toomre diagram for our objects (b). For both plots (a) and (b), our ultracool dwarfs are in black solid circles. The blue squares are objects in binary systems, The green dashed curve shows the thick-thin disk limit (Venn et al. 2004) of total velocity. The blue and yellow dashed curve indicates the thick and halo limit from Nissen & Schuster (2010) or Bonaca et al. (2017).
Current usage metrics show cumulative count of Article Views (full-text article views including HTML views, PDF and ePub downloads, according to the available data) and Abstracts Views on Vision4Press platform.
Data correspond to usage on the plateform after 2015. The current usage metrics is available 48-96 hours after online publication and is updated daily on week days.
Initial download of the metrics may take a while.