Free Access
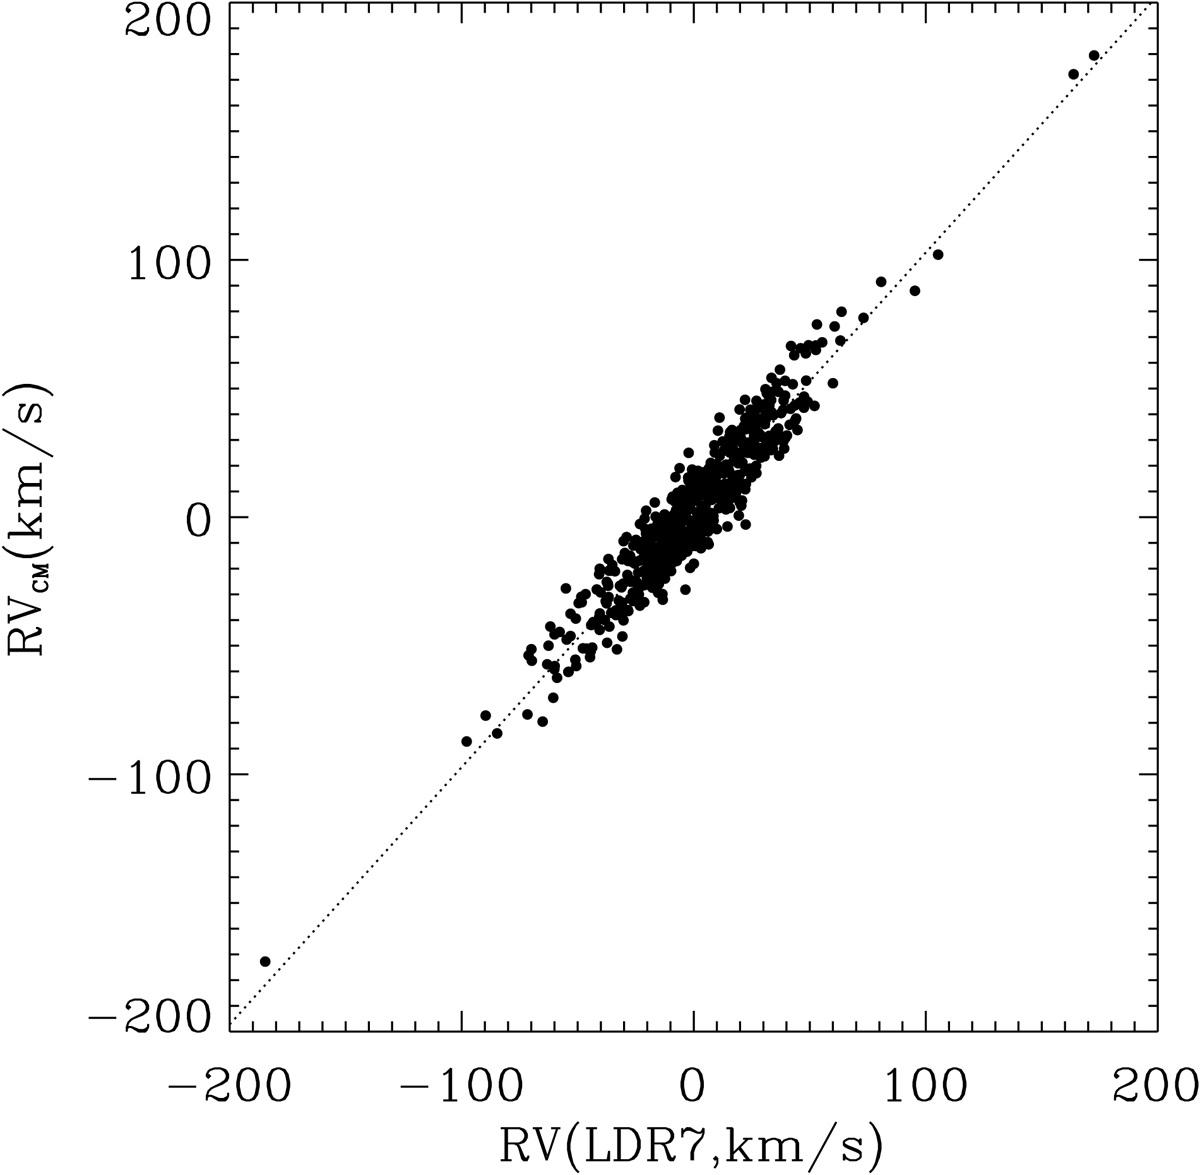
Fig. 7.
Download original image
Comparison of the LDR7 RV versus RVCM after a 3 sigma clip on the residuals of the two sets of RVs. The x-axis is the LDR7 RV and y-axis RVCM. The ultracool dwarfs in our sample are shown in black solid circles.
Current usage metrics show cumulative count of Article Views (full-text article views including HTML views, PDF and ePub downloads, according to the available data) and Abstracts Views on Vision4Press platform.
Data correspond to usage on the plateform after 2015. The current usage metrics is available 48-96 hours after online publication and is updated daily on week days.
Initial download of the metrics may take a while.