Fig. 6.
Download original image
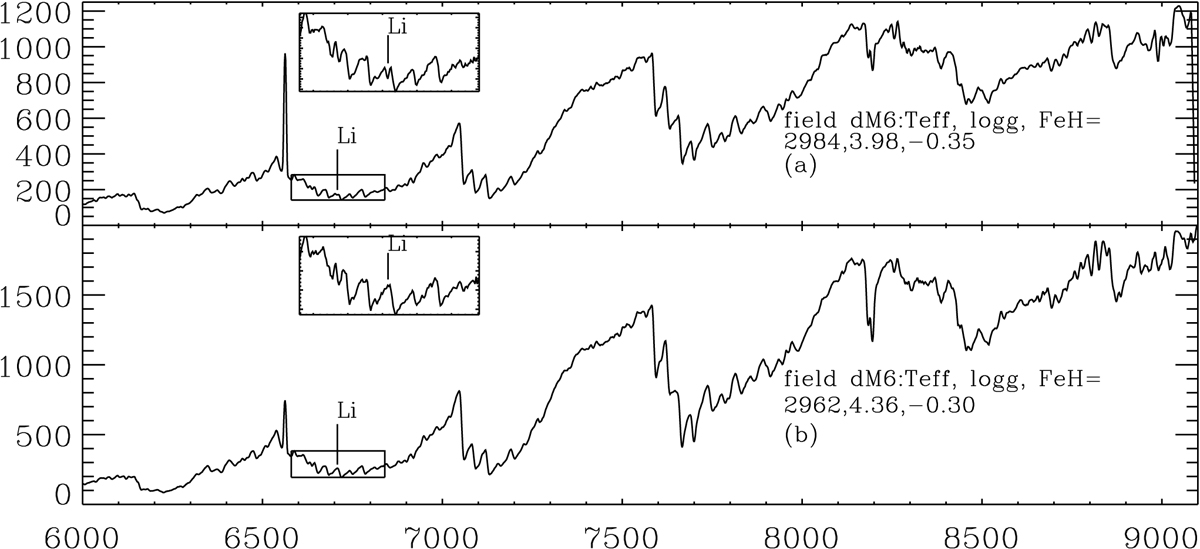
Comparison of two spectra based on their 6708 Å lithium lines: One with the lithium line and another without. Panel a shows an M6 spectrum with a lithium absorption line. An M6 spectrum without lithium is shown in panel b for comparison. The small windows in each panel zoom in on the region that containing the 6708 Å lithium line. The atmosphere parameters from the LAMOST 1D pipeline are labeled.
Current usage metrics show cumulative count of Article Views (full-text article views including HTML views, PDF and ePub downloads, according to the available data) and Abstracts Views on Vision4Press platform.
Data correspond to usage on the plateform after 2015. The current usage metrics is available 48-96 hours after online publication and is updated daily on week days.
Initial download of the metrics may take a while.