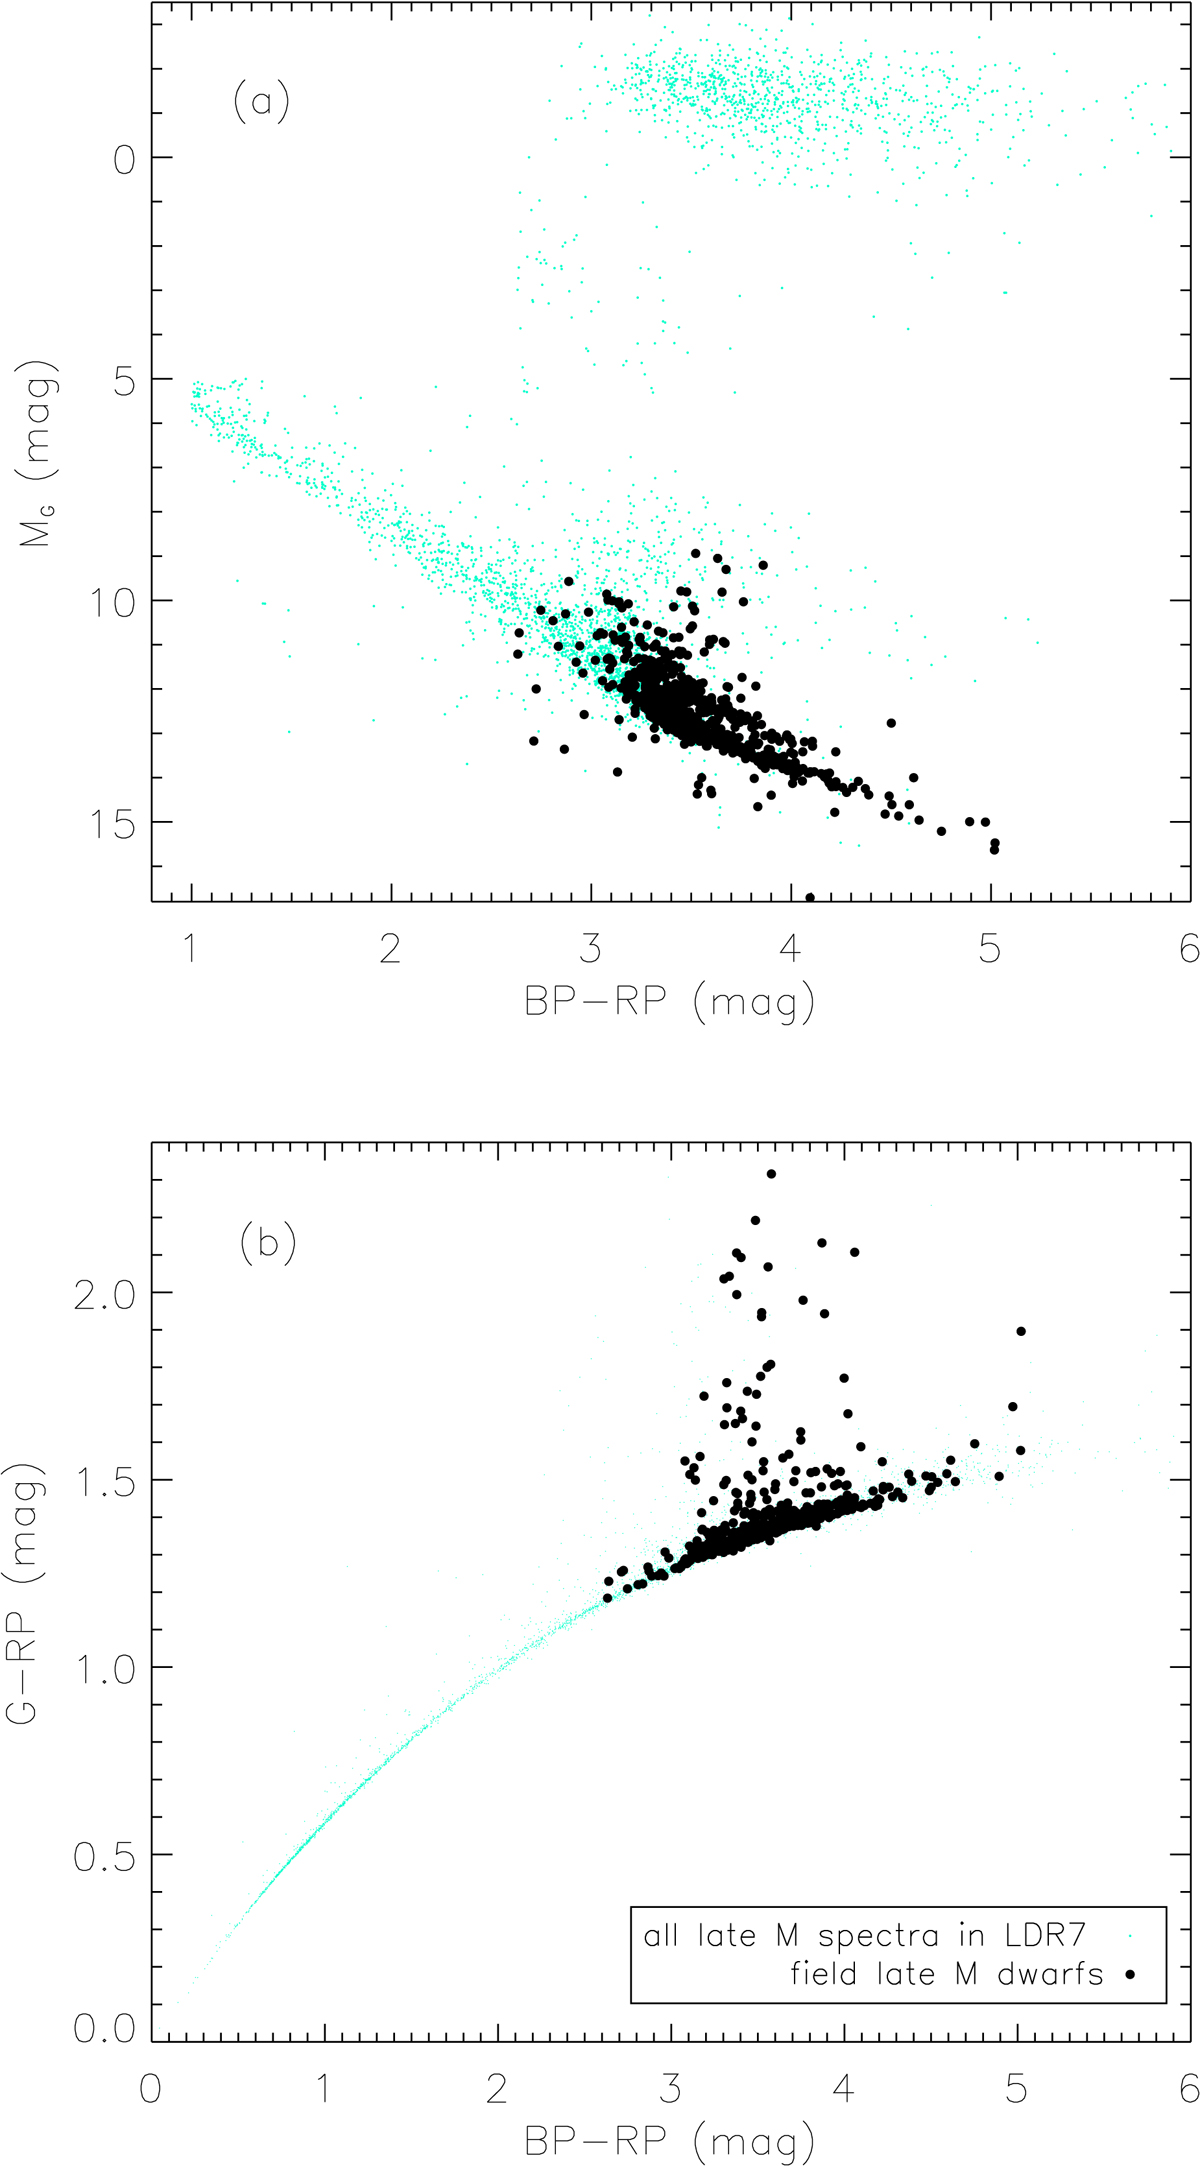
Fig. 5.
Download original image
(a) G absolute magnitude versus BP − RP diagram. G absolute magnitude computed from the inverse of the parallax with no correction of extinction. The entire LAMOST DR7 late M sample is plotted in cyan dots, whereas the ultracool dwarfs are in black solid circles. (b) Gaia G − RP versus BP − RP color-color diagram. Symbols are the same as in the top panel.
Current usage metrics show cumulative count of Article Views (full-text article views including HTML views, PDF and ePub downloads, according to the available data) and Abstracts Views on Vision4Press platform.
Data correspond to usage on the plateform after 2015. The current usage metrics is available 48-96 hours after online publication and is updated daily on week days.
Initial download of the metrics may take a while.