Fig. 3.
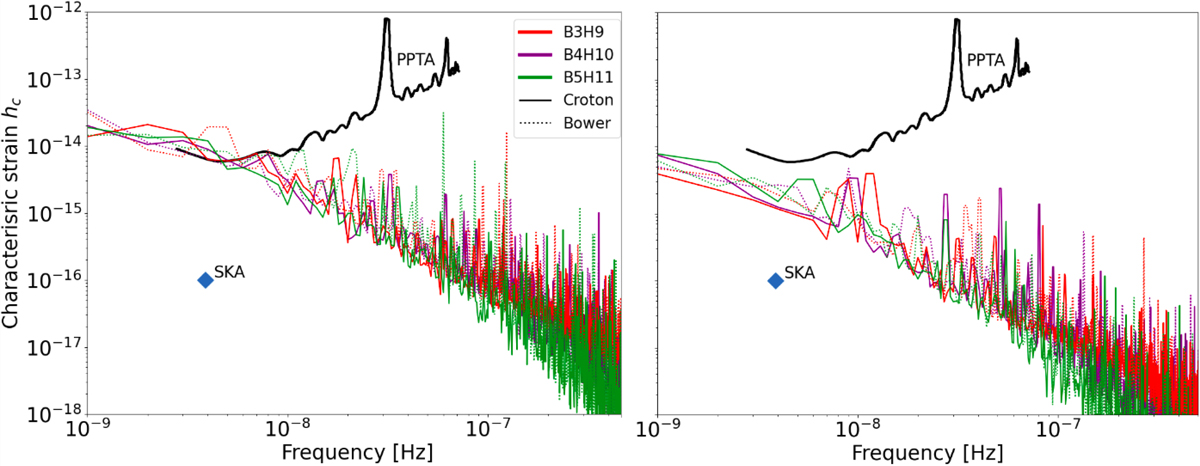
Download original image
GWB characteristic strain comparison between default Croton16 and Bower06 models (η = 0.1 and fedd = 0.01). Panel on the left shows models with time to coalescence up to 100 Myr, while on the right, the maximum time is 1 Gyr. The black line and blue diamond show the observationally constrained limit (PPTA; Shannon et al. 2015) and estimated SKA sensitivity (at the most most sensitive frequency), respectively.
Current usage metrics show cumulative count of Article Views (full-text article views including HTML views, PDF and ePub downloads, according to the available data) and Abstracts Views on Vision4Press platform.
Data correspond to usage on the plateform after 2015. The current usage metrics is available 48-96 hours after online publication and is updated daily on week days.
Initial download of the metrics may take a while.