Fig. 1.
Download original image
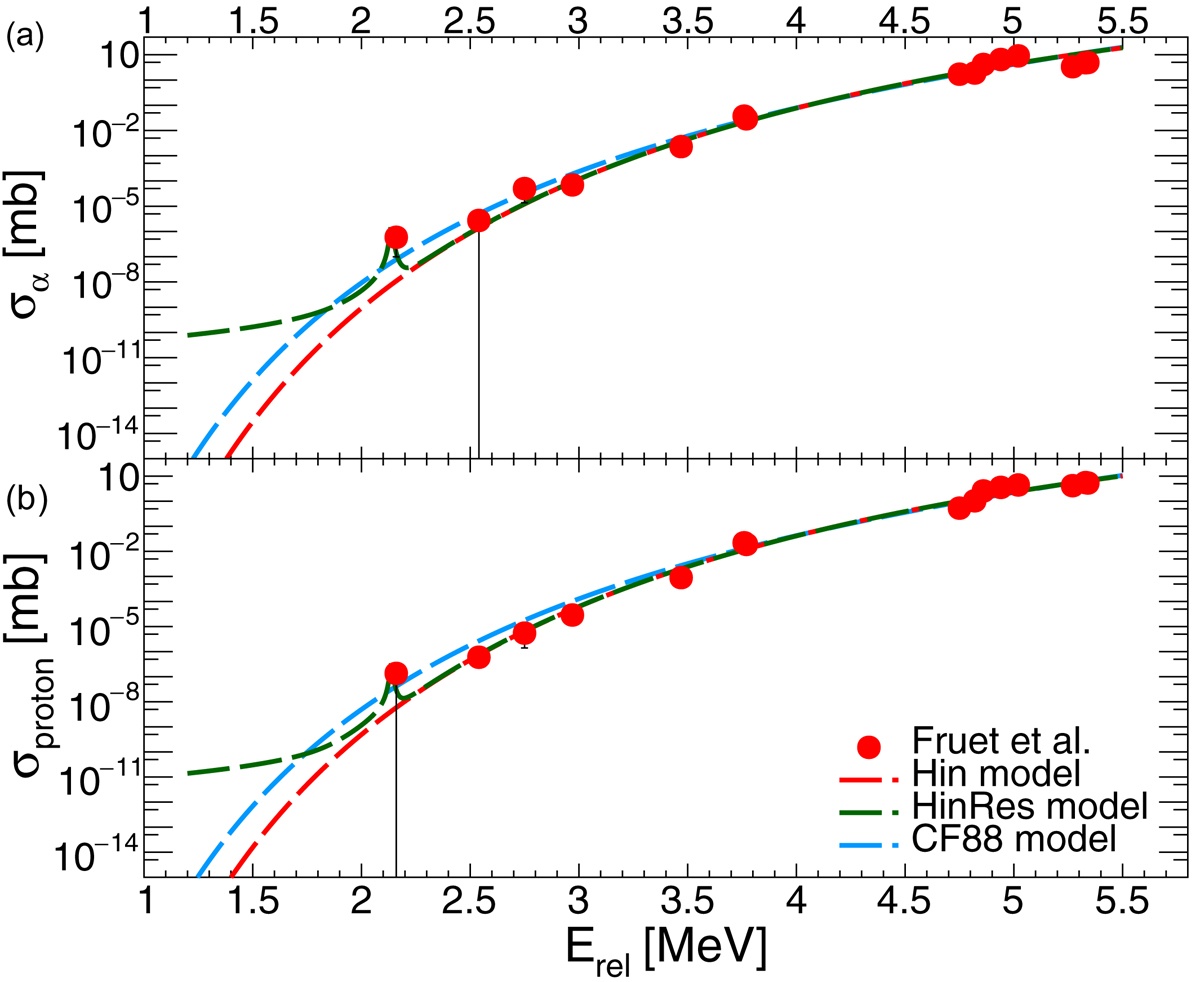
Cross sections for alpha (a) and proton (b) channels, obtained with STELLA (red points). Adjustments made for the Hin model (red curve) and HinRes model (green curve) are compared with the cross section from the CF88 model (blue curve). Data points at the lowest energy for protons and the second lowest for the α channel are upper limits (vertical black lines).
Current usage metrics show cumulative count of Article Views (full-text article views including HTML views, PDF and ePub downloads, according to the available data) and Abstracts Views on Vision4Press platform.
Data correspond to usage on the plateform after 2015. The current usage metrics is available 48-96 hours after online publication and is updated daily on week days.
Initial download of the metrics may take a while.