Fig. 8.
Download original image
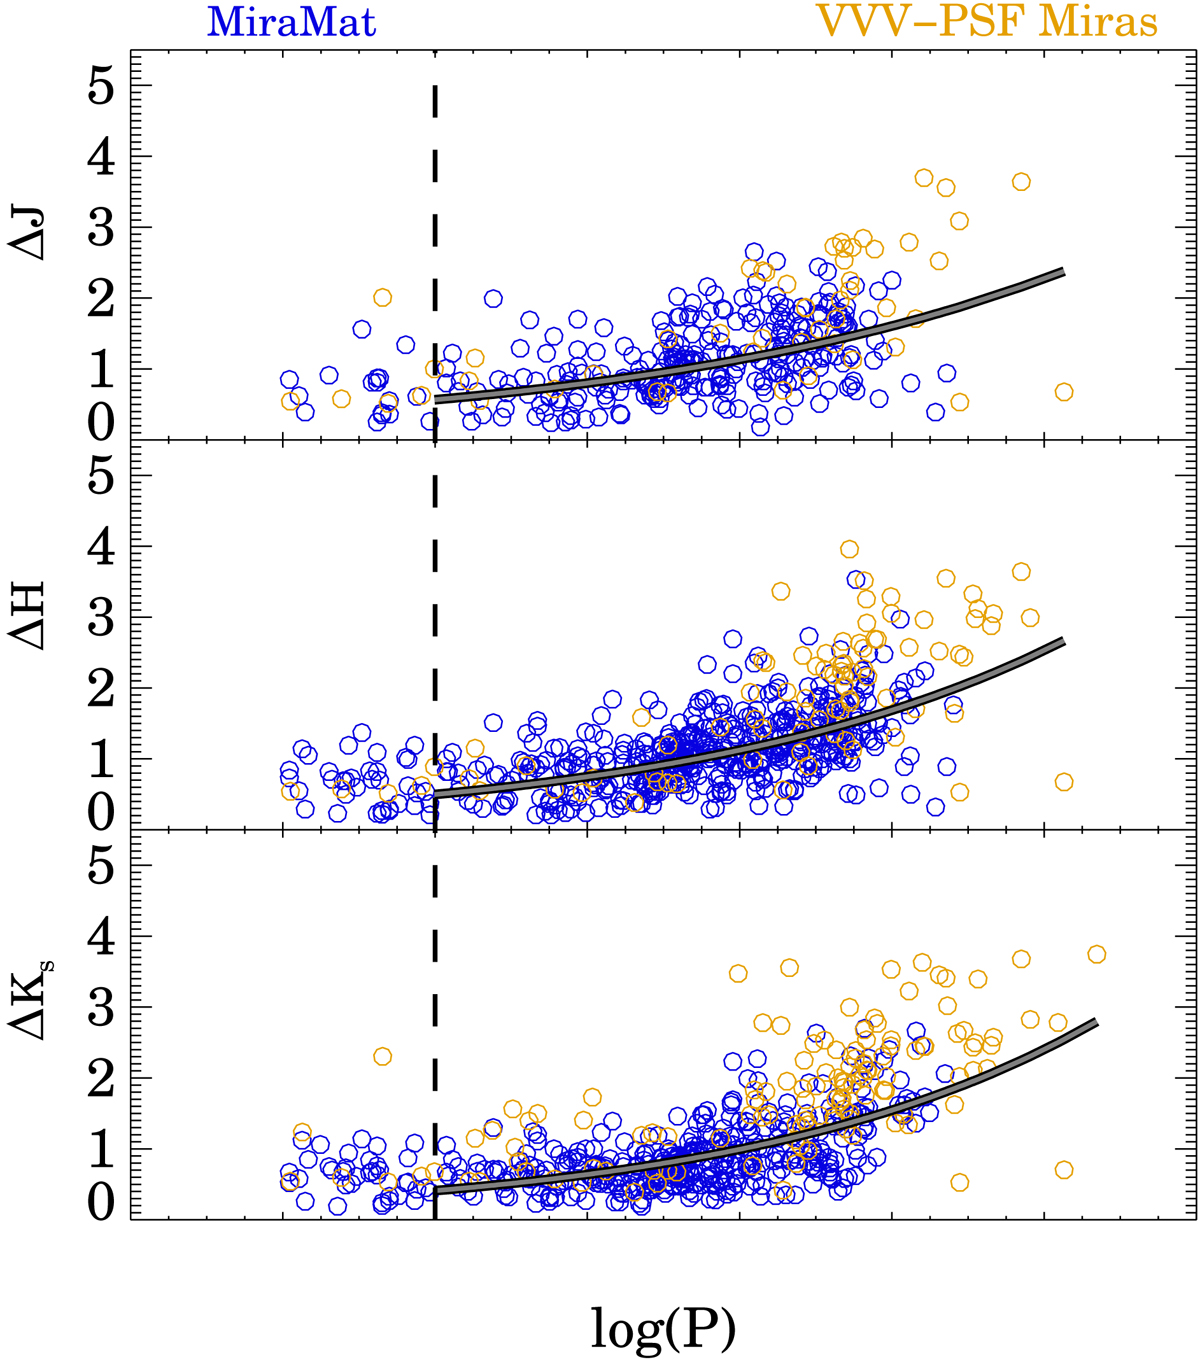
ΔJ, ΔH, and ΔKs amplitudes as function of logarithmic period, from top to bottom, respectively. The VVV-PSF Miras (orange circles) and MiraMat Miras (blue circles) are displayed. The dashed line marks the short-period limit of the Conroy et al. (2015) relation (Eq. (7)). The lines show our fits for the combined sample of VVV-PSF and MiraMat Miras.
Current usage metrics show cumulative count of Article Views (full-text article views including HTML views, PDF and ePub downloads, according to the available data) and Abstracts Views on Vision4Press platform.
Data correspond to usage on the plateform after 2015. The current usage metrics is available 48-96 hours after online publication and is updated daily on week days.
Initial download of the metrics may take a while.