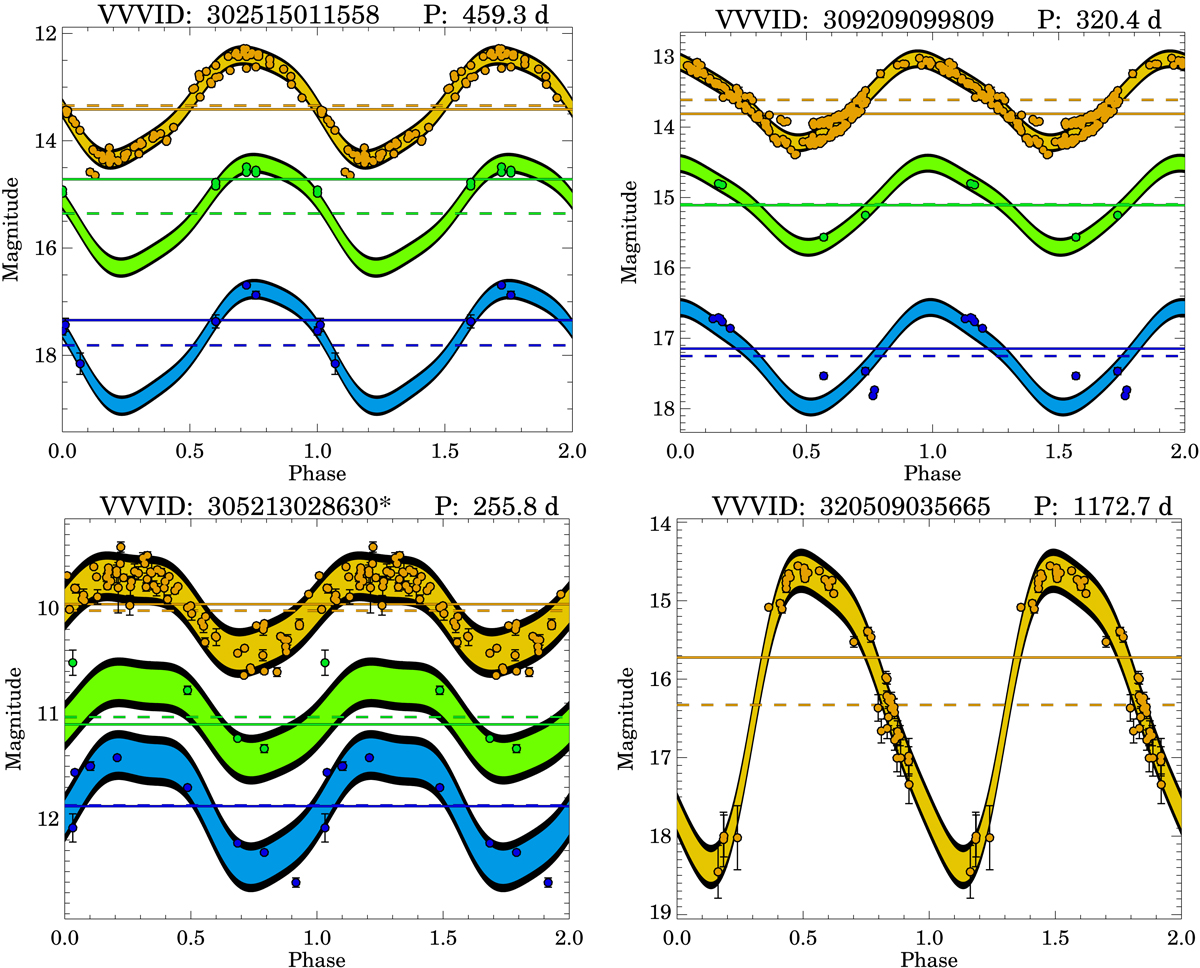
Fig. 6.
Download original image
Examples of folded light curves in J (blue), H (green), and Ks (yellow). The solid and dashed lines represent the mean magnitudes considering a straight average over the available observations and best-fit template model (if available), respectively. The color bands around data points correspond to a 2σ range around the mean. The VVV-ID and periods are included on top of each panel. In the bottom right panel, no data are available in the J and H bands, and so only the Ks photometry shown. We note that distances could be computed for both stars in the upper row, but not for those in the bottom row, due to saturation (bottom left panel) or a period that places the star outside the distance indicator regime (bottom right panel).
Current usage metrics show cumulative count of Article Views (full-text article views including HTML views, PDF and ePub downloads, according to the available data) and Abstracts Views on Vision4Press platform.
Data correspond to usage on the plateform after 2015. The current usage metrics is available 48-96 hours after online publication and is updated daily on week days.
Initial download of the metrics may take a while.