Fig. 5.
Download original image
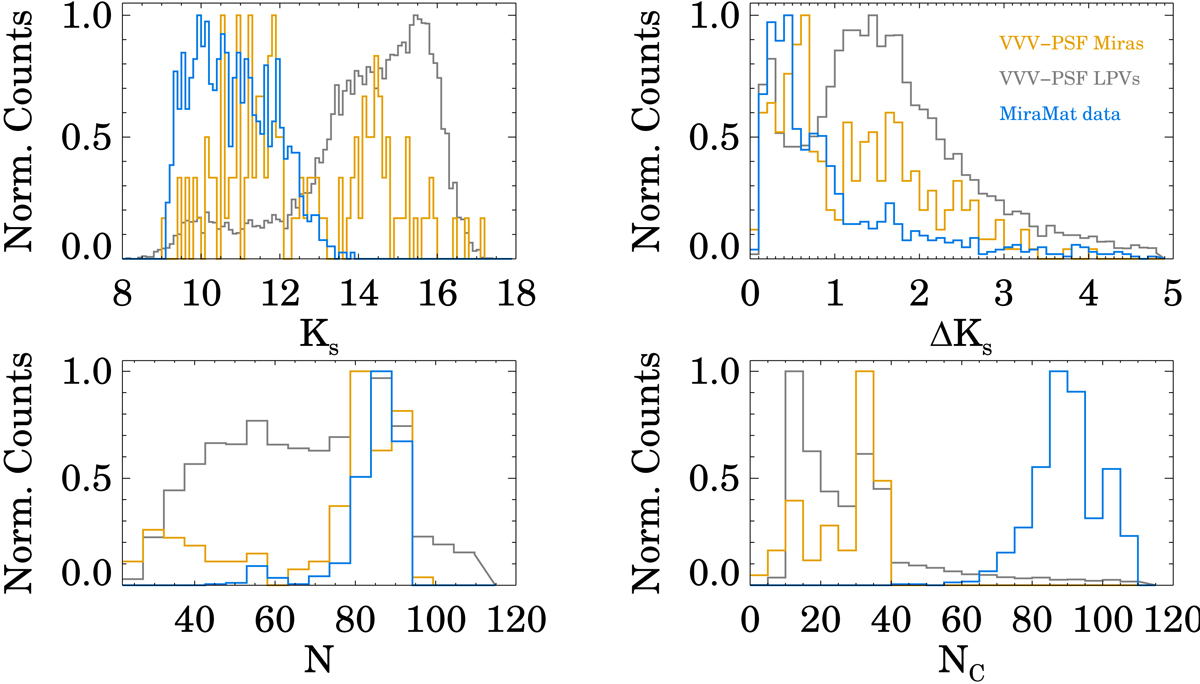
Comparison of VVV-PSF candidates with the sample of Miras from Matsunaga et al. (2009). Histograms are shown of mean Ks-band magnitudes (upper left), amplitudes ΔKs (upper right), number of observations N (bottom left), and number of correlated measurements NC (bottom right). The VVV-PSF Miras, MiraMat sample, and VVV-PSF LPV candidates are shown in blue, yellow, and gray, respectively.
Current usage metrics show cumulative count of Article Views (full-text article views including HTML views, PDF and ePub downloads, according to the available data) and Abstracts Views on Vision4Press platform.
Data correspond to usage on the plateform after 2015. The current usage metrics is available 48-96 hours after online publication and is updated daily on week days.
Initial download of the metrics may take a while.