Free Access
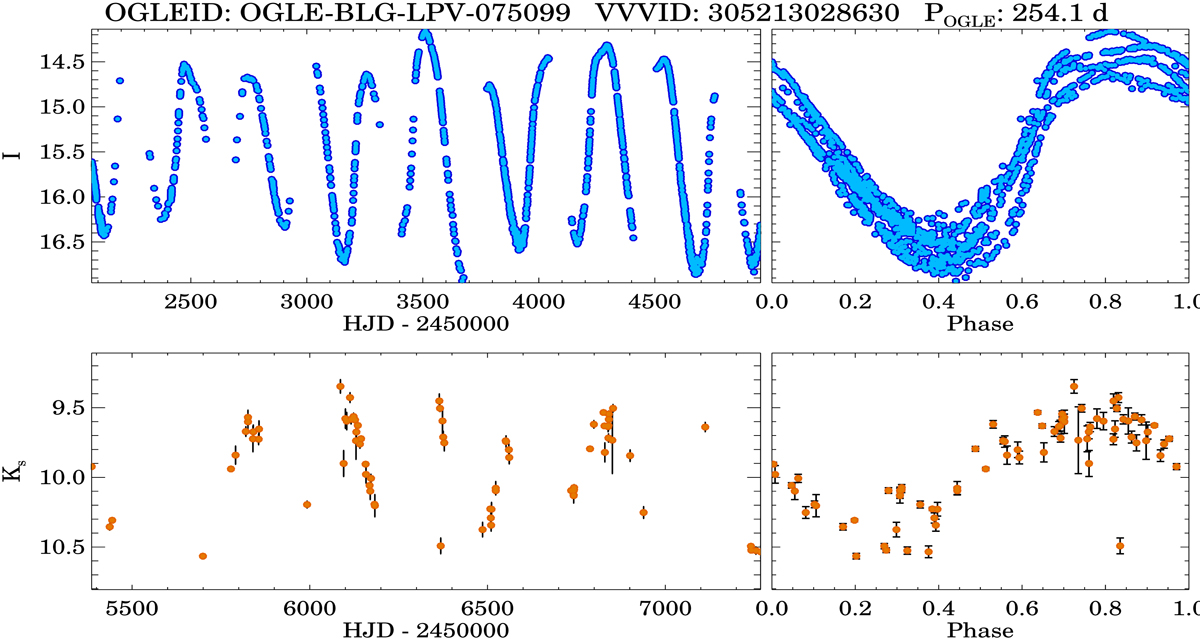
Fig. 4.
Download original image
Example of raw (left) and phased (right) light curves, for a source cross-matched between OGLE (top panel) and VVV (bottom panel). The OGLE and VVV IDs, as well as the period found by OGLE, are displayed in the top panel.
Current usage metrics show cumulative count of Article Views (full-text article views including HTML views, PDF and ePub downloads, according to the available data) and Abstracts Views on Vision4Press platform.
Data correspond to usage on the plateform after 2015. The current usage metrics is available 48-96 hours after online publication and is updated daily on week days.
Initial download of the metrics may take a while.