Fig. 2.
Download original image
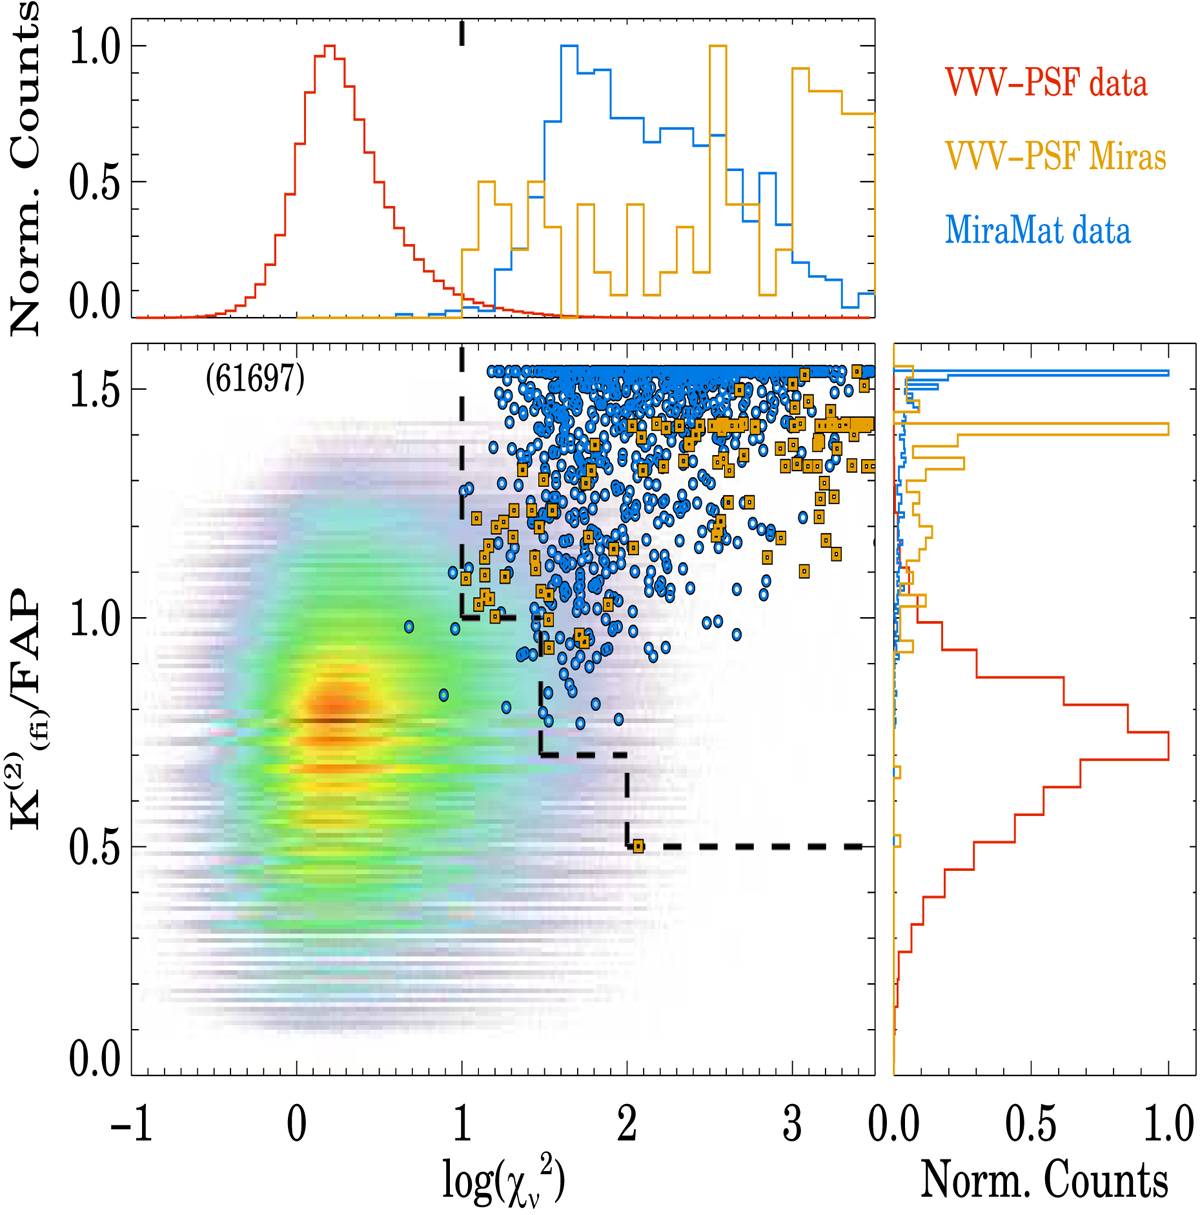
Distribution of VVV-PSF sources in the ![]() vs.
vs. ![]() plane. The Miras identified by Matsunaga et al. (2009, labeled MiraMat in the plot) are shown as blue circles. The region marked by dashed lines corresponds to the one from which we extracted our initial Mira candidates. The latter, upon further analysis and inspection, eventually led to our final selection of Miras, shown in this plot as orange squares. The maximum number of targets per pixel is 61 697 in this plot, corresponding to the dark orange-red region in the main panel.
plane. The Miras identified by Matsunaga et al. (2009, labeled MiraMat in the plot) are shown as blue circles. The region marked by dashed lines corresponds to the one from which we extracted our initial Mira candidates. The latter, upon further analysis and inspection, eventually led to our final selection of Miras, shown in this plot as orange squares. The maximum number of targets per pixel is 61 697 in this plot, corresponding to the dark orange-red region in the main panel.
Current usage metrics show cumulative count of Article Views (full-text article views including HTML views, PDF and ePub downloads, according to the available data) and Abstracts Views on Vision4Press platform.
Data correspond to usage on the plateform after 2015. The current usage metrics is available 48-96 hours after online publication and is updated daily on week days.
Initial download of the metrics may take a while.