Free Access
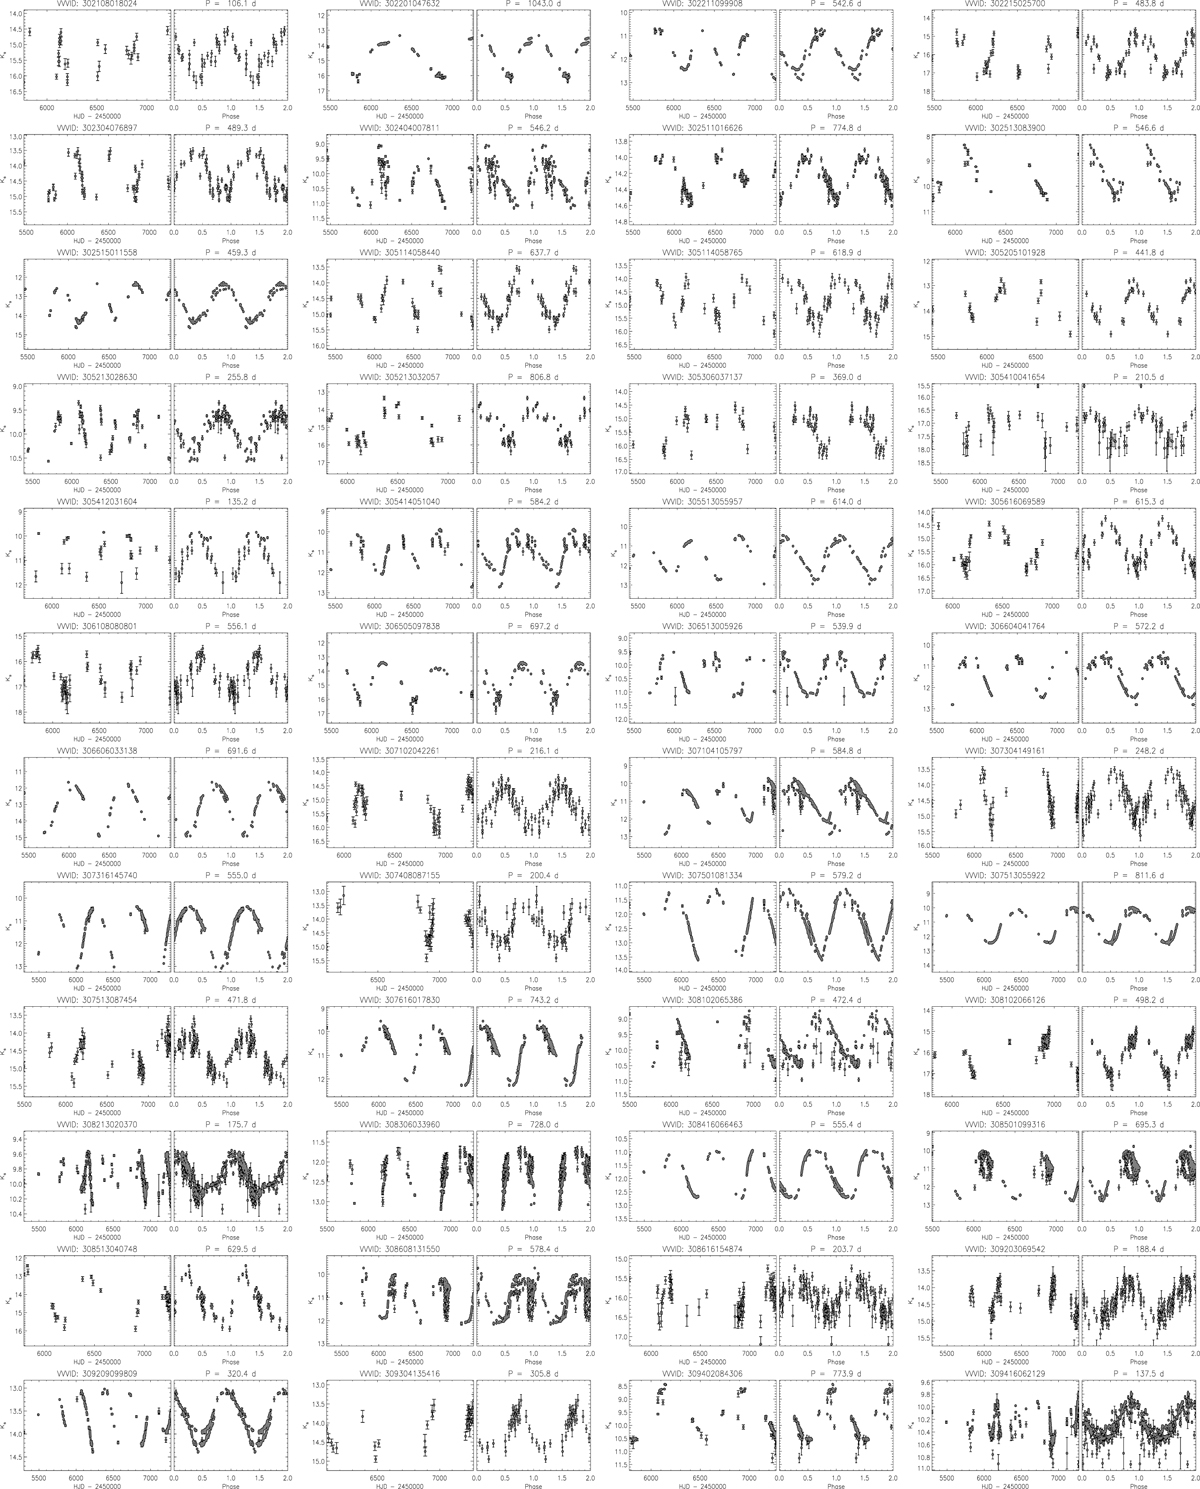
Fig. A.1.
Download original image
VVV-PSF light curves in the Ks band for the sample of Mira candidates. For each star, both the raw time series (left panels) and phased light curves (right panels) are shown. The VVV ID is displayed on top of the left panel, whereas our derived period is given at the top of the right panel.
Current usage metrics show cumulative count of Article Views (full-text article views including HTML views, PDF and ePub downloads, according to the available data) and Abstracts Views on Vision4Press platform.
Data correspond to usage on the plateform after 2015. The current usage metrics is available 48-96 hours after online publication and is updated daily on week days.
Initial download of the metrics may take a while.