Fig. 13.
Download original image
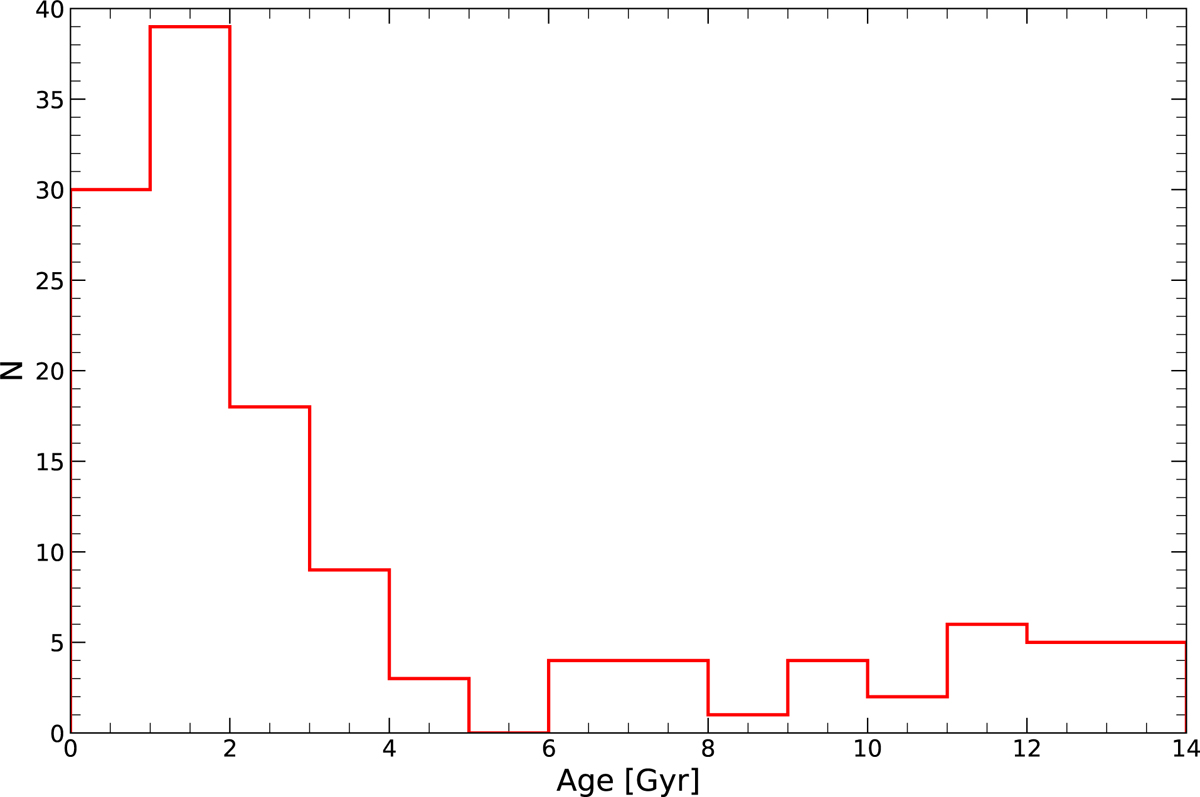
Histogram of ages for the Mira stars in our sample. The ages are given in Gyr, and were computed based on the stars’ periods according to Eq. (13). The bimodal age distribution is a direct consequence of the bimodal distribution in periods (Fig. 7): the minimum close to 365 d corresponds to an age of 4.9 Gyr, according to Eq. (13).
Current usage metrics show cumulative count of Article Views (full-text article views including HTML views, PDF and ePub downloads, according to the available data) and Abstracts Views on Vision4Press platform.
Data correspond to usage on the plateform after 2015. The current usage metrics is available 48-96 hours after online publication and is updated daily on week days.
Initial download of the metrics may take a while.