Fig. 12.

Download original image
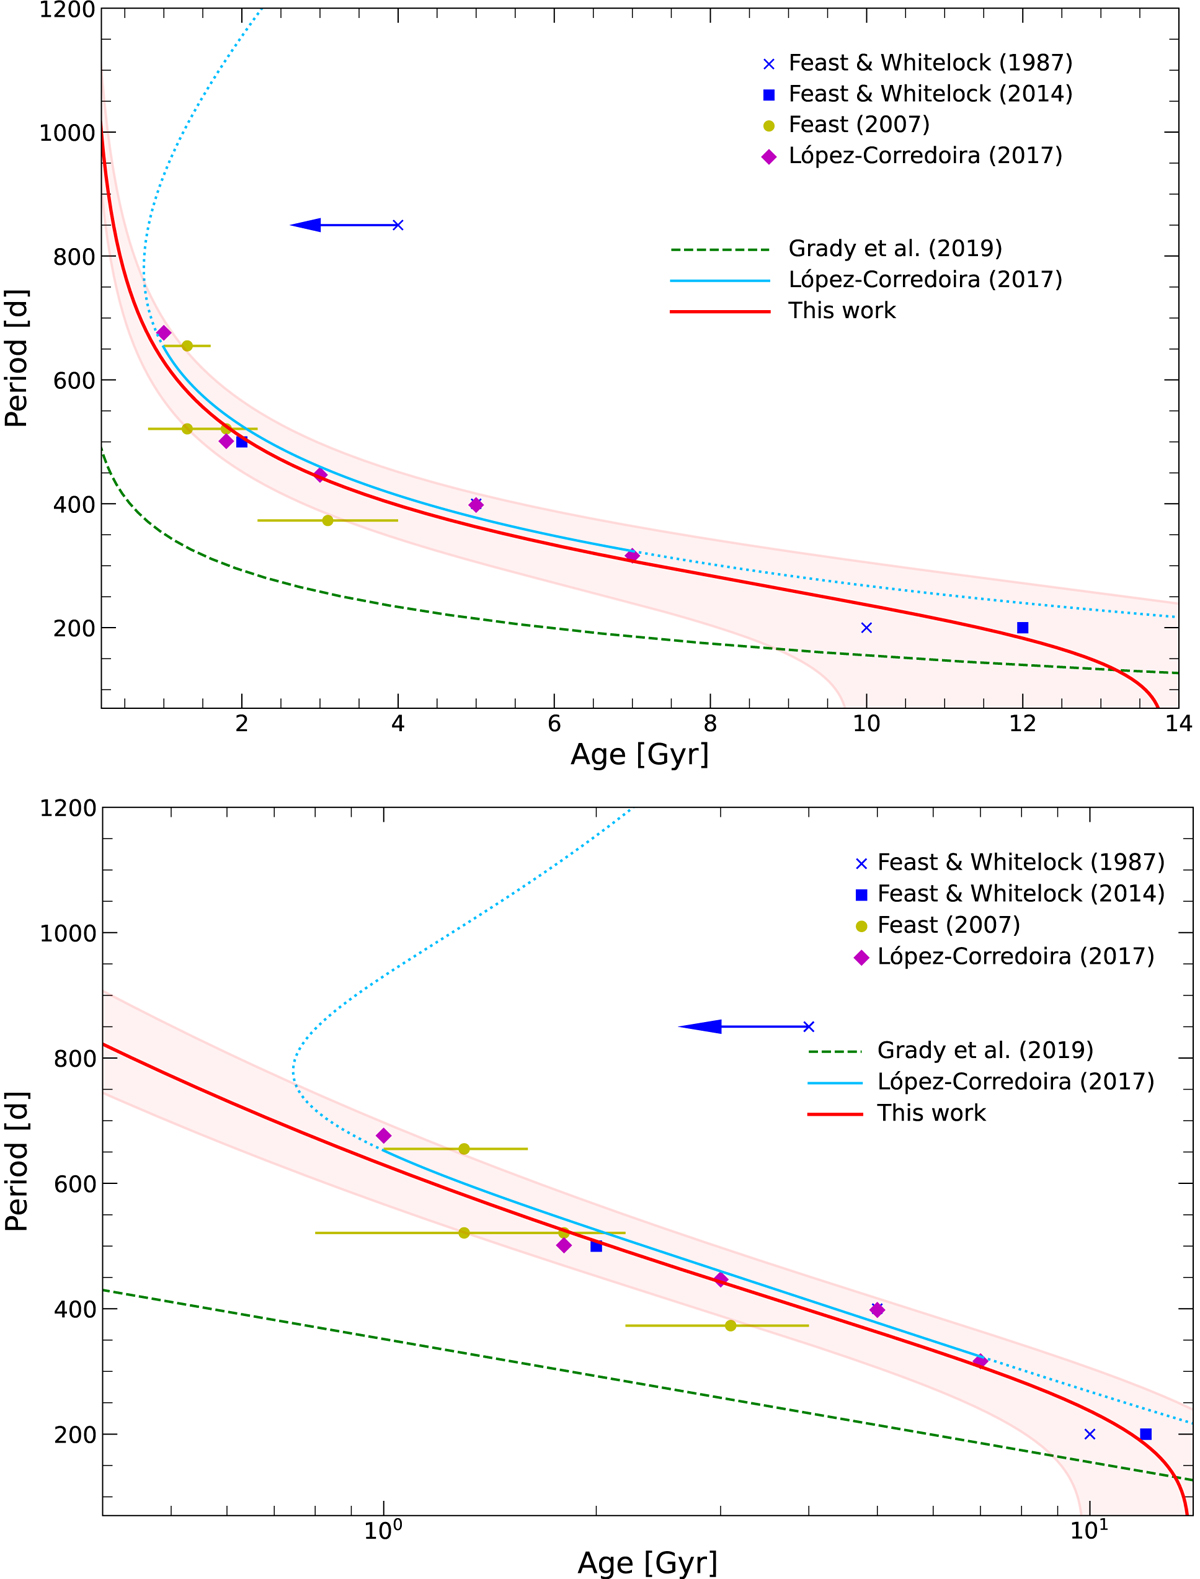
Period-age relations for Mira variables, shown in a linear scale (upper panel) and using a logarithmic scale for the ages (bottom panel). Blue crosses, blue squares, yellow circles, and magenta diamonds represent datapoints extracted from Feast & Whitelock (1987, 2014), Feast (2007), and López-Corredoira (2017), respectively. The blue arrows indicate that only an upper limit on the age is available. The green dashed line represents the relation suggested by Grady et al. (2019) whereas the light blue solid line the relation by López-Corredoira (2017). The light blue dotted line segments illustrate the expected behavior of the López-Corredoira (2017) relation, when it is extrapolated beyond its formal range of validity. The red line is the relation proposed in this work (Eq. (13)), and the light red band represents a dispersion of Δlog t = ±0.15 around it, which basically encompasses all available measurements in the literature, but may be an underestimate at the long-period/short-age end in particular, where empirical data are not yet available.
Current usage metrics show cumulative count of Article Views (full-text article views including HTML views, PDF and ePub downloads, according to the available data) and Abstracts Views on Vision4Press platform.
Data correspond to usage on the plateform after 2015. The current usage metrics is available 48-96 hours after online publication and is updated daily on week days.
Initial download of the metrics may take a while.


