Fig. 11.
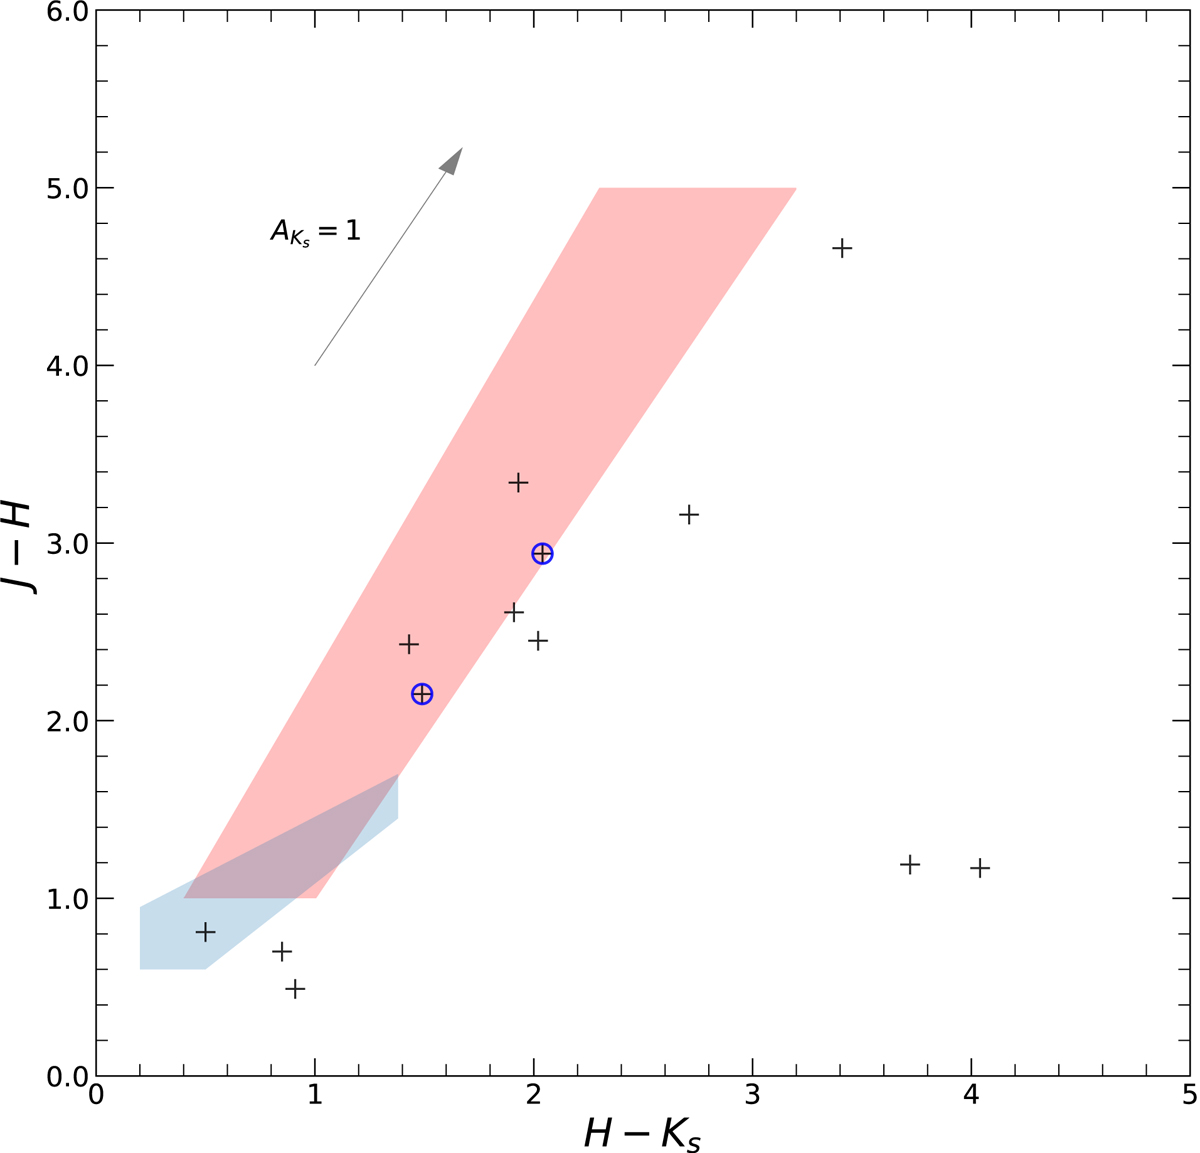
Download original image
Color-color (J − H vs. H − Ks) plot for the nonsaturated candidate Miras in our sample for which measurements in the three bandpasses could be obtained (crosses). The two stars in our distance indicator sample are marked with blue circles. The shaded blue and red regions are schematic depictions of the loci occupied by Miras and SRVs in the Kerschbaum et al. (2001) and Matsunaga et al. (2009) samples, respectively. The arrow at the top of the figure indicates the reddening vector for an absolute extinction of 1 mag in Ks, assuming a D19 extinction law (see Table 4).
Current usage metrics show cumulative count of Article Views (full-text article views including HTML views, PDF and ePub downloads, according to the available data) and Abstracts Views on Vision4Press platform.
Data correspond to usage on the plateform after 2015. The current usage metrics is available 48-96 hours after online publication and is updated daily on week days.
Initial download of the metrics may take a while.