Fig. 10.
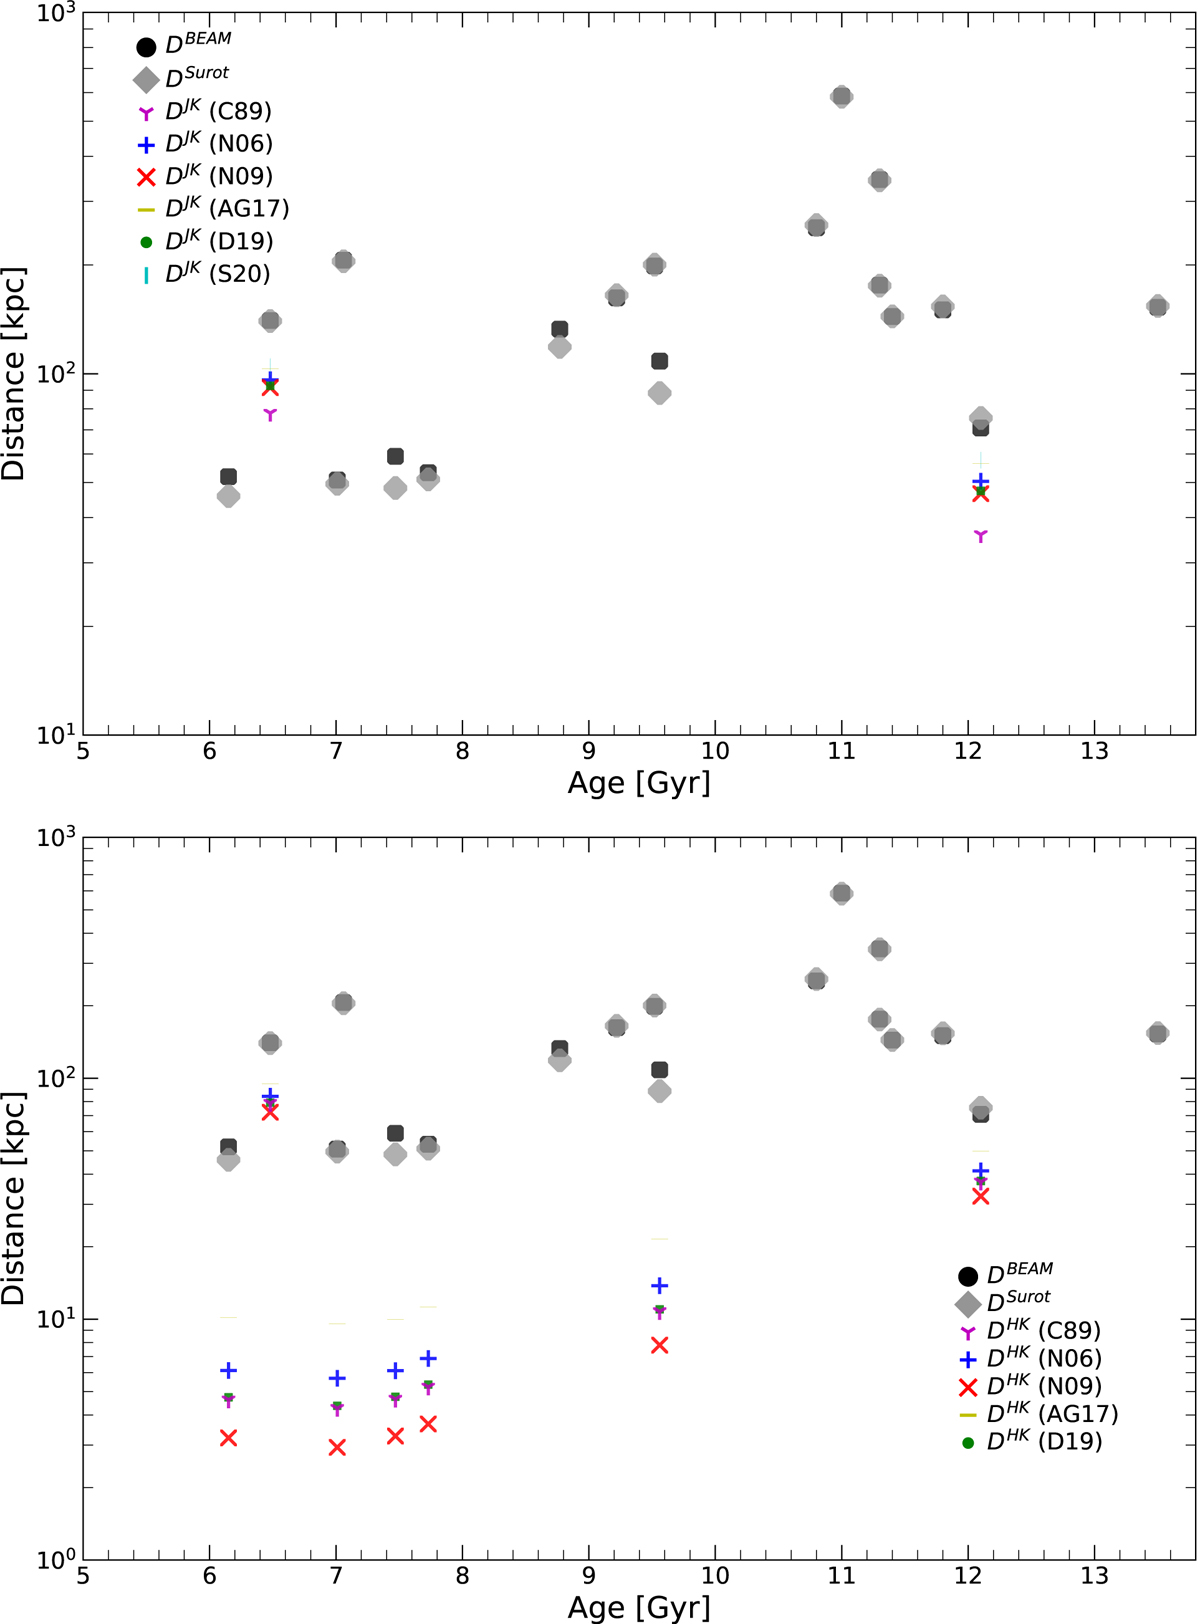
Download original image
Distribution of distances (in kpc) versus ages (in Gyr) for the distance indicator Mira stars in our sample. DJKs (top panel) and DHKs (bottom panel) values are computed using the different indicated extinction laws (see Table 4). DBEAM and DSurot values are shown in both panels, and were computed from the E(J − Ks) values provided by the BEAM and Surot maps assuming a Surot et al. (2020) extinction law. These maps are based primarily on bulge red clump stars, hence are not expected to accurately measure the reddening toward objects located beyond the Galactic bulge; accordingly, the corresponding distances should be considered as upper limits only. Due to lack of J-band measurements, several of the stars that are shown in the bottom panel with their respective DHKs values do not have DJKs data shown in the top panel (see also Table 6. Ages were computed following Eq. (13). We note that the age range is restricted in this plot, as only Miras that have periods in the range [100, 350] d (i.e., distance indicators) are included, corresponding to an age range of [5.4, 13.6] Gyr according to Eq. (13).
Current usage metrics show cumulative count of Article Views (full-text article views including HTML views, PDF and ePub downloads, according to the available data) and Abstracts Views on Vision4Press platform.
Data correspond to usage on the plateform after 2015. The current usage metrics is available 48-96 hours after online publication and is updated daily on week days.
Initial download of the metrics may take a while.