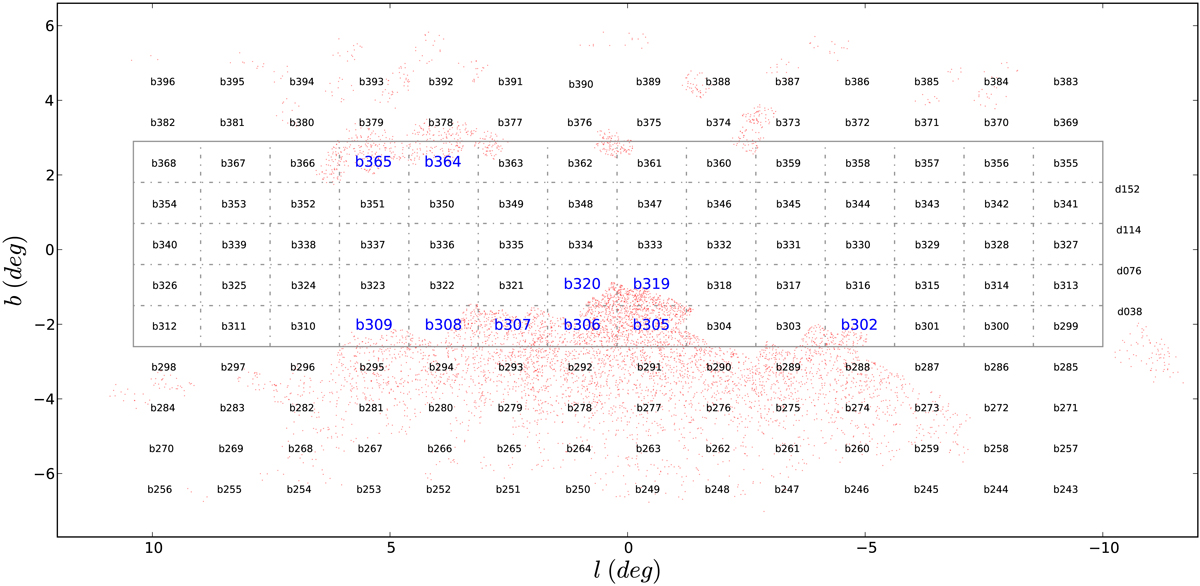
Fig. 1.
Download original image
Footprint of the VVV survey in the central bulge of the MW, expressed in Galactic coordinates. Each VVV tile is marked by its respective ID in this diagram, those analyzed in this work being highlighted in blue and using a larger font size. Red dots represent stars classified as Miras in the OGLE-III project. The gray grids present a region of the VVV footprint where our PSF photometry is already completed.
Current usage metrics show cumulative count of Article Views (full-text article views including HTML views, PDF and ePub downloads, according to the available data) and Abstracts Views on Vision4Press platform.
Data correspond to usage on the plateform after 2015. The current usage metrics is available 48-96 hours after online publication and is updated daily on week days.
Initial download of the metrics may take a while.