Fig. 5.
Download original image
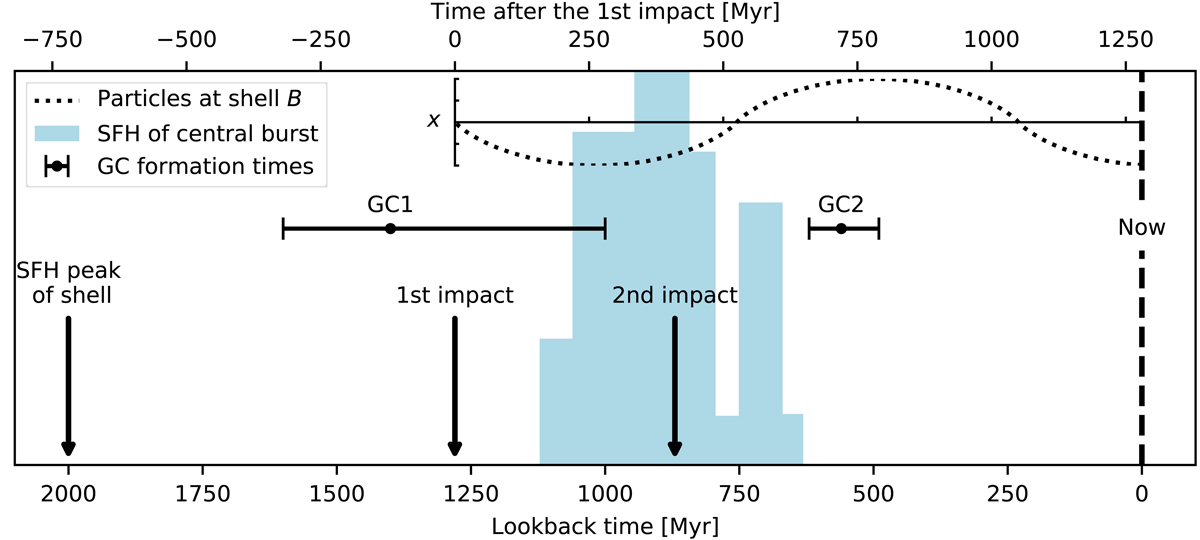
Timeline of the formation of NGC 474 according our scenario. The arrows indicate the peak of the star formation history of the stellar population of shell B (Alabi et al. 2020) and the first and second pericentric passage of the secondary. The star formation history of the young stellar population (Fensch et al. 2020) is shown by the light blue bar plot(in arbitrary units). The horizontal error bars mark the ages of the young globular clusters GC1 and GC2 (Fensch et al. 2020). The dotted line represents the evolution of the x-coordinate of a particle that was released from the secondary during the first pericentric encounter of the galaxies and that currently lies at the edge of the shell B, assuming that the merger was radial. The x-coordinate here coincides with the collision axis, so that the secondary galaxy approached from the upper part of the x-axis.
Current usage metrics show cumulative count of Article Views (full-text article views including HTML views, PDF and ePub downloads, according to the available data) and Abstracts Views on Vision4Press platform.
Data correspond to usage on the plateform after 2015. The current usage metrics is available 48-96 hours after online publication and is updated daily on week days.
Initial download of the metrics may take a while.