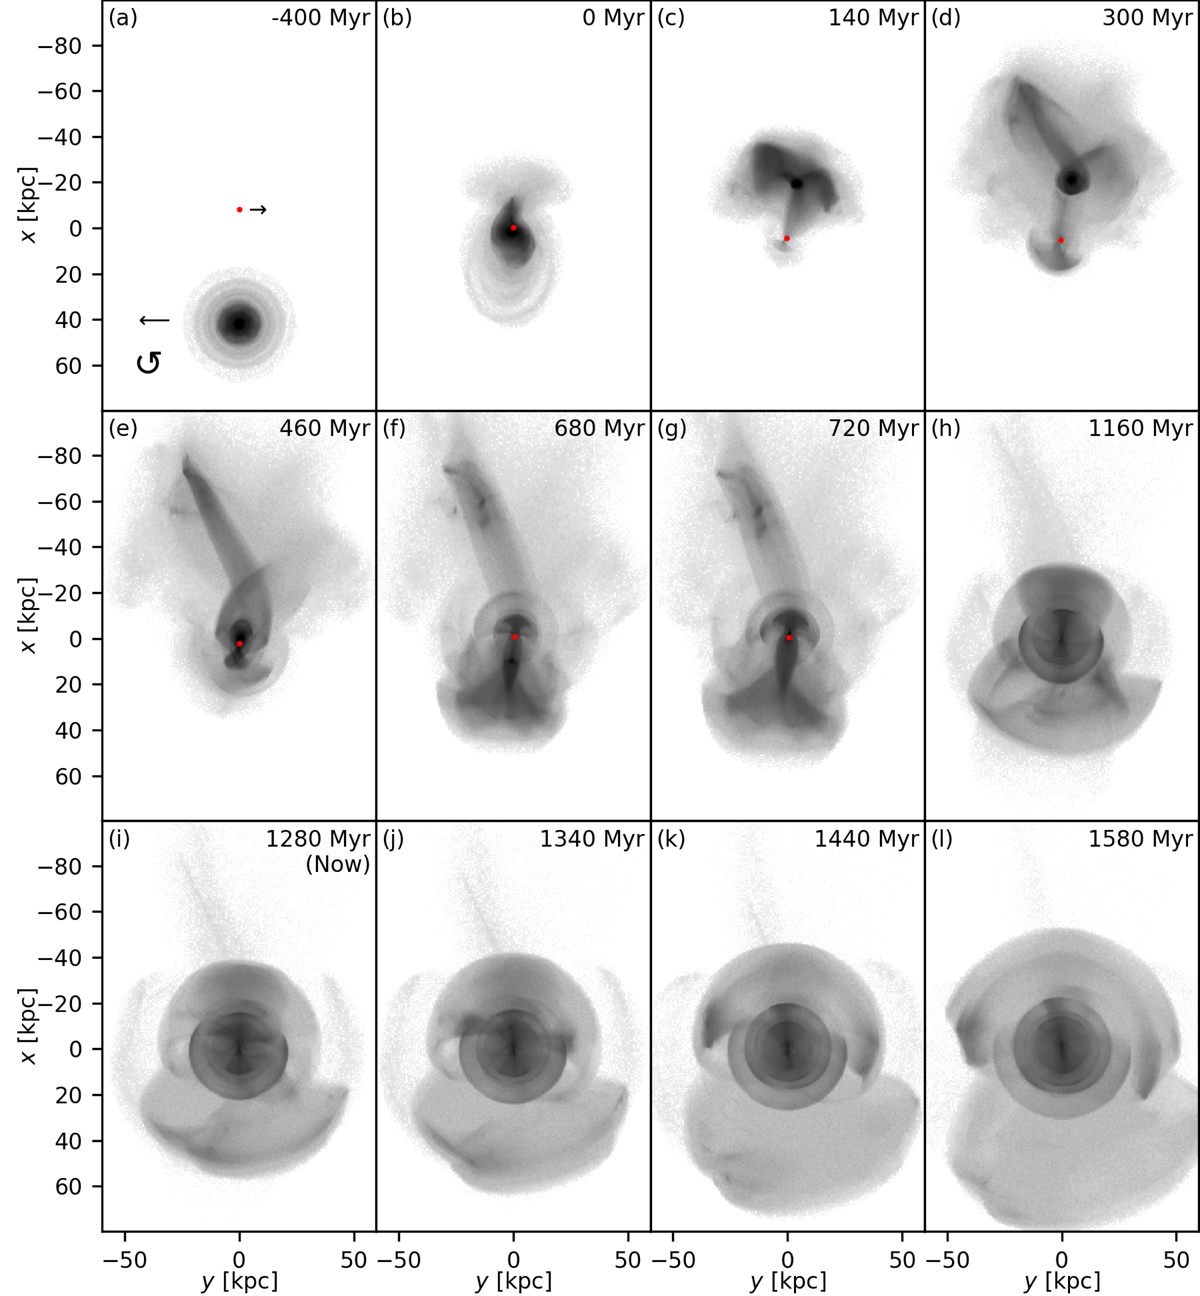
Fig. 3.
Download original image
Snapshots of the stellar surface density from the MOND simulation. The numbers in the panels indicate the time after the first pericenter of the galaxies. Only the material that originally belonged to the secondary galaxy is displayed. The position of the primary is marked by the red point in the first several plots. At later times, it virtually lies at the origin. The analytic models predict that the shell radii of NGC 474 are reproduced at the time corresponding to panel (i). The corresponding video is available online.
Current usage metrics show cumulative count of Article Views (full-text article views including HTML views, PDF and ePub downloads, according to the available data) and Abstracts Views on Vision4Press platform.
Data correspond to usage on the plateform after 2015. The current usage metrics is available 48-96 hours after online publication and is updated daily on week days.
Initial download of the metrics may take a while.