Fig. 5
Download original image
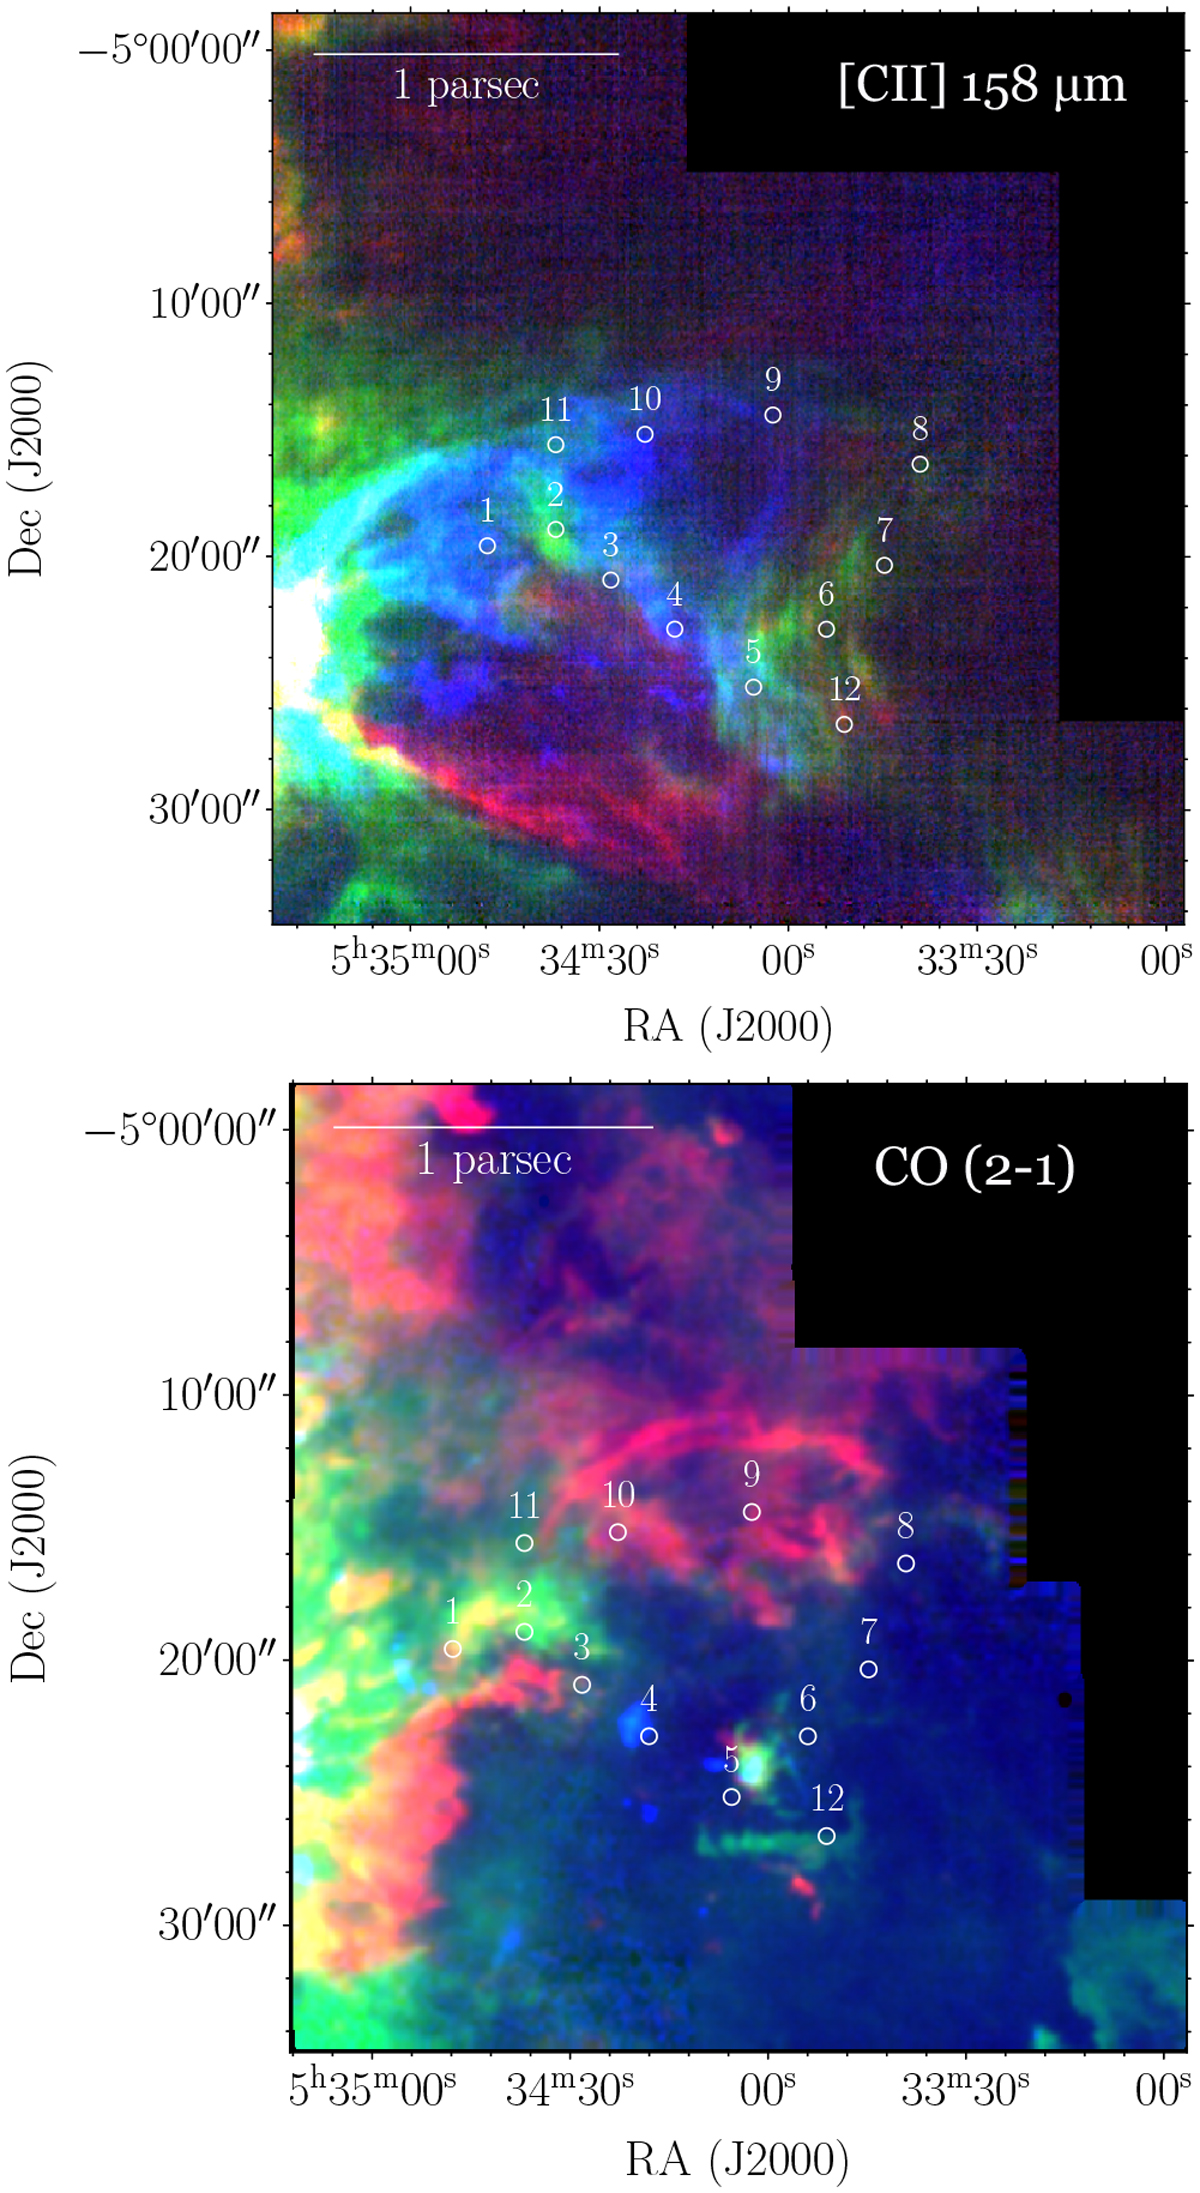
Three-color image of the protrusion created using the three components estimated in the [C II] line profile in Fig. 4. Blue emission is the integrated emission between −5 and +3 km s−1, green between +3 and +12 km s−1, and red between +12 and +15 km s−1 of the SOFIA [C II] 158 μm (upper panel) and IRAM 12CO (lower panel) emission maps. White circles show the 12 selected positions from Fig. 4. A movie is available online.
Current usage metrics show cumulative count of Article Views (full-text article views including HTML views, PDF and ePub downloads, according to the available data) and Abstracts Views on Vision4Press platform.
Data correspond to usage on the plateform after 2015. The current usage metrics is available 48-96 hours after online publication and is updated daily on week days.
Initial download of the metrics may take a while.