Fig. 4
Download original image
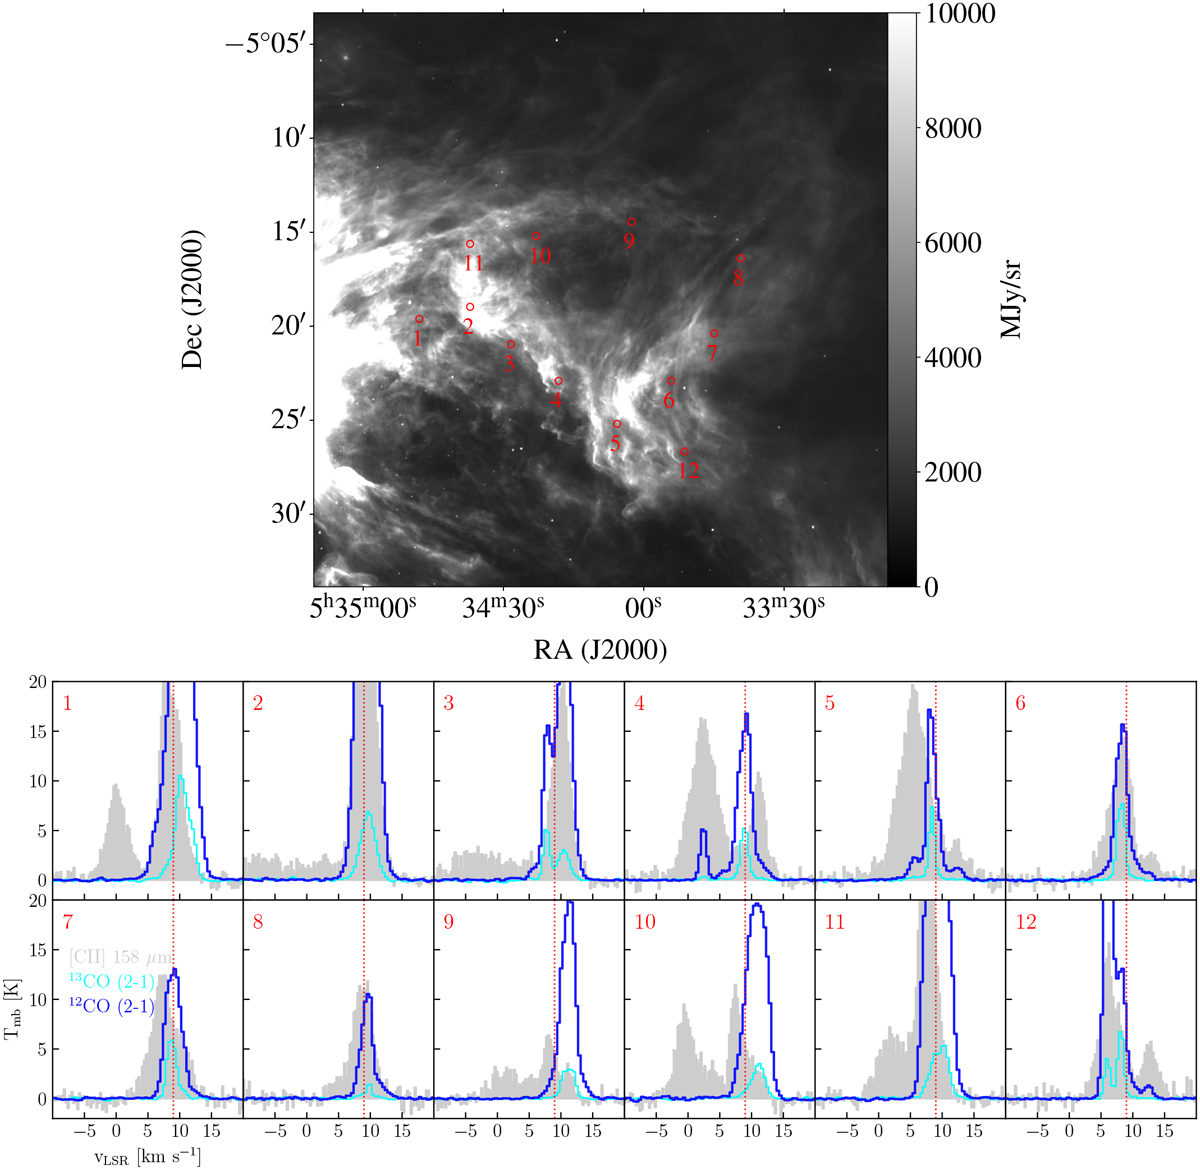
Spectral lines toward the protrusion. Upper panel: Spitzer 8 μm image of the protrusion. Red circles indicate the 12 positions that we used to extract line profiles and have an aperture of 16′′. Lower panel: velocity-resolved spectra of [C II] (colored in gray), 12CO J = 2−1 (blue), and 13CO J = 2−1 (cyan) in the direction of protrusion for the 12 selected positions in the upper panel. The vertical dotted red line at 9 km s−1 marks the approximate velocity of the emission generated by the OMC and the associated star-forming molecular cloud behind the Veil.
Current usage metrics show cumulative count of Article Views (full-text article views including HTML views, PDF and ePub downloads, according to the available data) and Abstracts Views on Vision4Press platform.
Data correspond to usage on the plateform after 2015. The current usage metrics is available 48-96 hours after online publication and is updated daily on week days.
Initial download of the metrics may take a while.