Fig. 3
Download original image
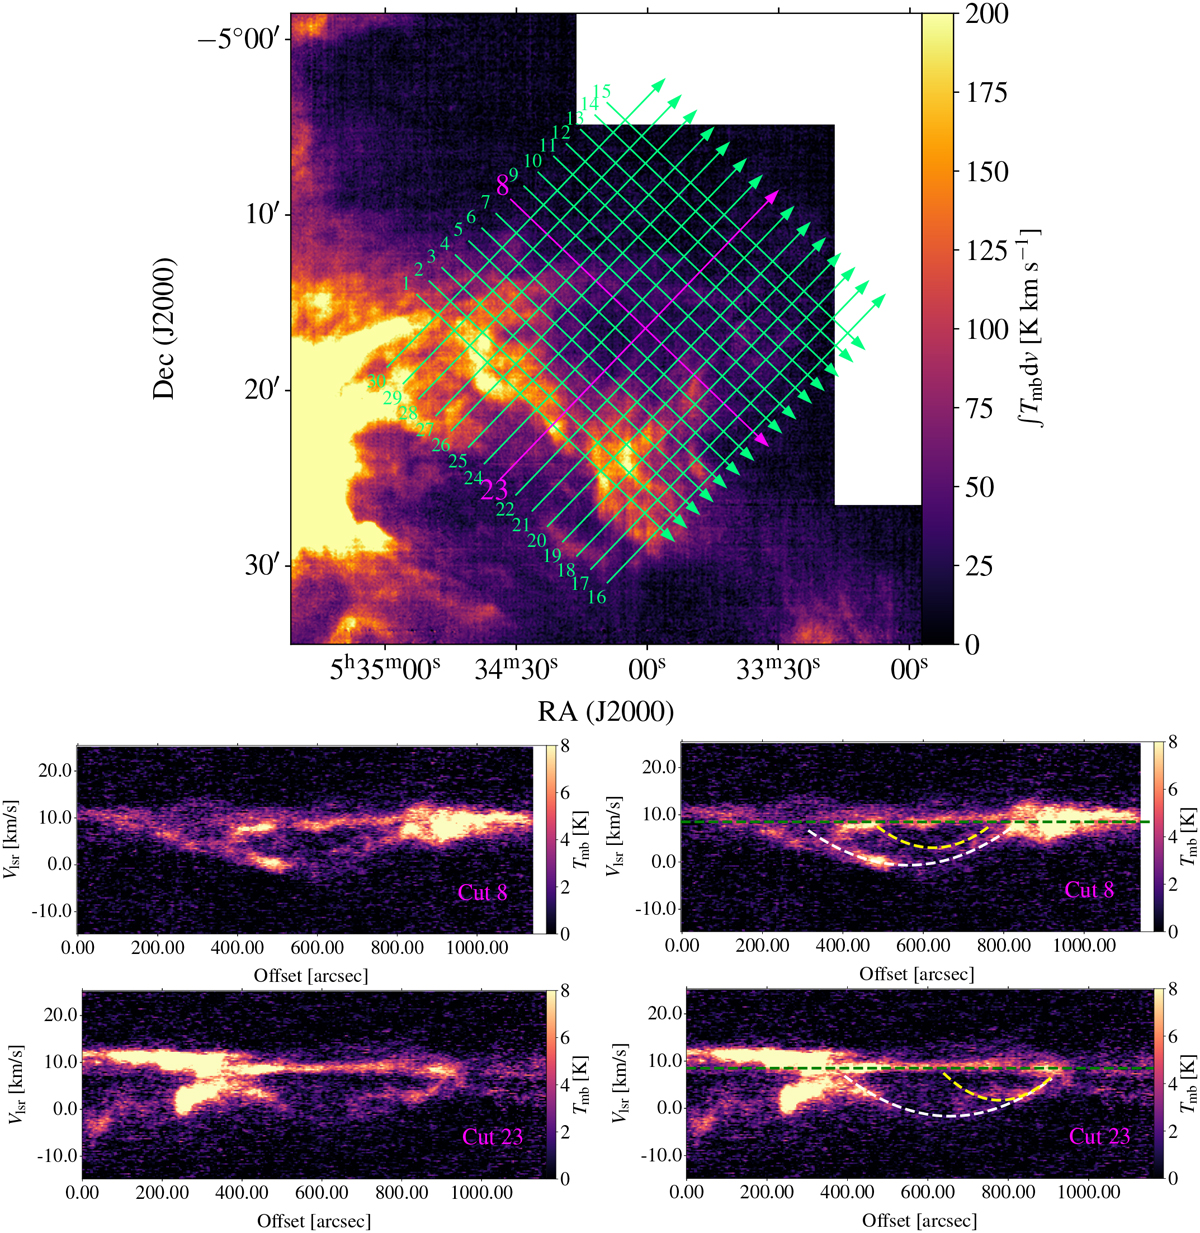
Two pv diagrams of the protrusion. Top: selected crosscuts along the green arrows overlaid on the integrated [C II] intensity map. The number of the crosscuts is indicated at the starting point of the cut. Middle and bottom: pv diagrams generated along the magenta crosscuts (cuts 8 and 23, respectively). The pv diagrams with horizontal green lines both show the [C II] emission produced by the FUV-illuminated surface of OMC, and the arcuate white and yellow lines trace the shell expanding at 12 km s−1 and 6 km s−1, respectively. The pv diagrams in Figs. B.9 and B.10 have the same scale on both axes. A 12CO-pv diagram along crosscut 23 is shown in Fig. B.8 for comparison with [C II].
Current usage metrics show cumulative count of Article Views (full-text article views including HTML views, PDF and ePub downloads, according to the available data) and Abstracts Views on Vision4Press platform.
Data correspond to usage on the plateform after 2015. The current usage metrics is available 48-96 hours after online publication and is updated daily on week days.
Initial download of the metrics may take a while.