Fig. B.7
Download original image
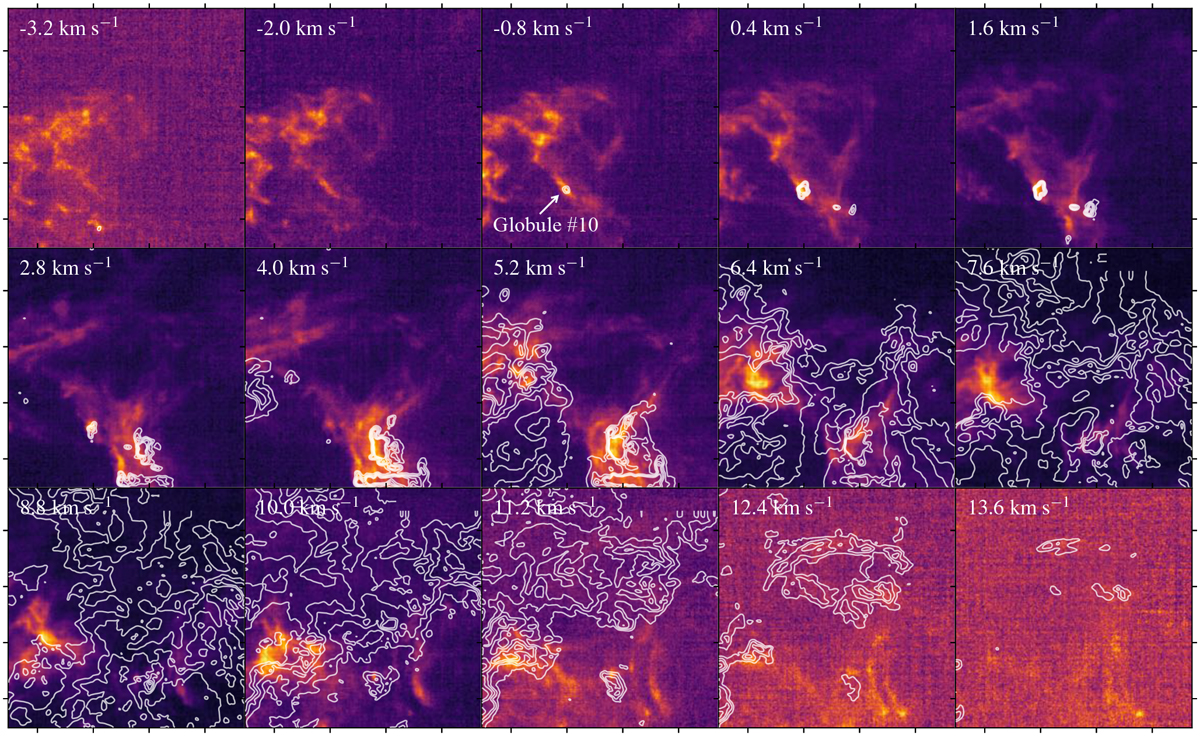
Channel map of [C II] emission from VLSR from −3.2 to +13.6 km s−1 overlaid with 12CO J = 2–1 observations (white contours). The contour levels are [3, 6, 10, 15, 20] K km s−1. The velocity resolution of both maps is smoothed to 0.5 km s−1. Globule #10, which is a bright CO emission with a velocity of −0.8 km s−1, is the CO globule reported in Orion’s Veil (see also Fig. B.8; Goicoechea et al. 2020).
Current usage metrics show cumulative count of Article Views (full-text article views including HTML views, PDF and ePub downloads, according to the available data) and Abstracts Views on Vision4Press platform.
Data correspond to usage on the plateform after 2015. The current usage metrics is available 48-96 hours after online publication and is updated daily on week days.
Initial download of the metrics may take a while.