Fig. 1
Download original image
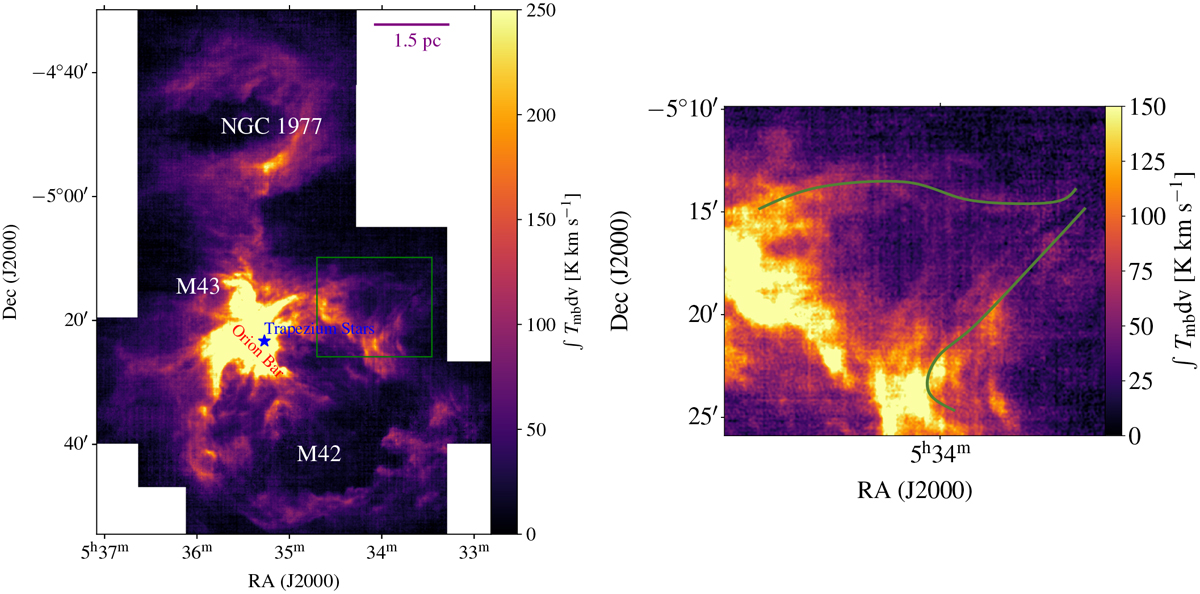
Integrated intensity [C II] 158 μm map. Left: integrated (between −5 and +14 km s−1) intensity [C II] 158 μm map of the OMC observed by the upGREAT receiver on board SOFIA. The positions of NGC 1977, Trapezium stars, M42, M43, and the Orion Bar PDR are labeled. The green box shows the extracted region from the map, including the area of interest for this study, the protrusion. Right: close-up view of the protrusion. The bright ridge of emission is the edge of the expanding Veil shell. Faint emission extends well beyond this shell – the protrusion of which has a multi-component structure. More details about the kinematics and components of the protrusion are given in Sect. 3.
Current usage metrics show cumulative count of Article Views (full-text article views including HTML views, PDF and ePub downloads, according to the available data) and Abstracts Views on Vision4Press platform.
Data correspond to usage on the plateform after 2015. The current usage metrics is available 48-96 hours after online publication and is updated daily on week days.
Initial download of the metrics may take a while.