Fig. 9
Download original image
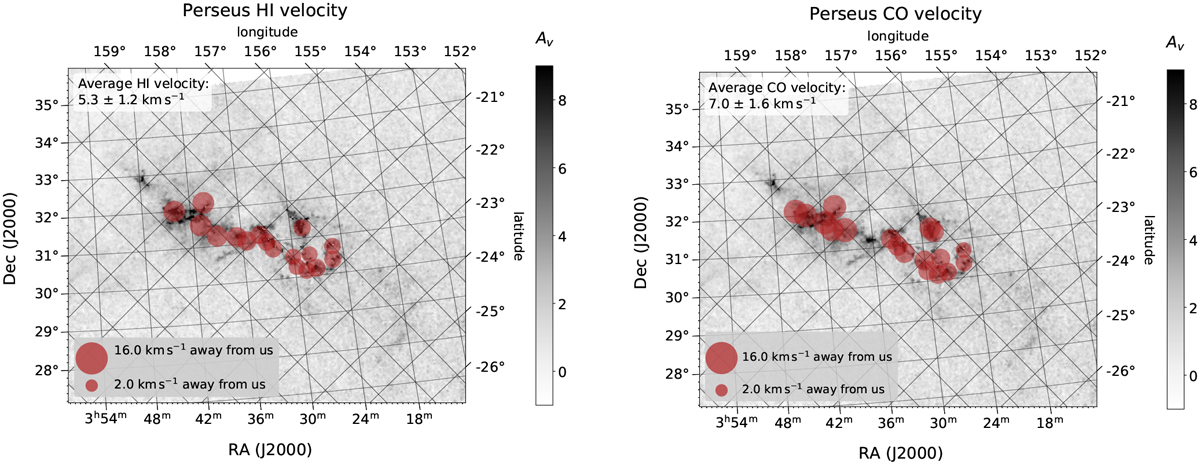
Perseus molecular cloud H I and CO velocities (LSR) from HI4PI Collaboration (2016) and Dame et al. (2001), respectively. The red circles show velocities pointing away from us. This figure shows our first approach for determining the vCO - H I direction, as described in Sect. 4.1. The size of the circles shows the magnitude of the velocities. The background gray-scale image shows the extinction map in Av magnitude as obtained by Kainulainen et al. (2009). Left panel: circles show the H I velocities. Right panel: circles show the CO velocities.
Current usage metrics show cumulative count of Article Views (full-text article views including HTML views, PDF and ePub downloads, according to the available data) and Abstracts Views on Vision4Press platform.
Data correspond to usage on the plateform after 2015. The current usage metrics is available 48-96 hours after online publication and is updated daily on week days.
Initial download of the metrics may take a while.