Fig. 8
Download original image
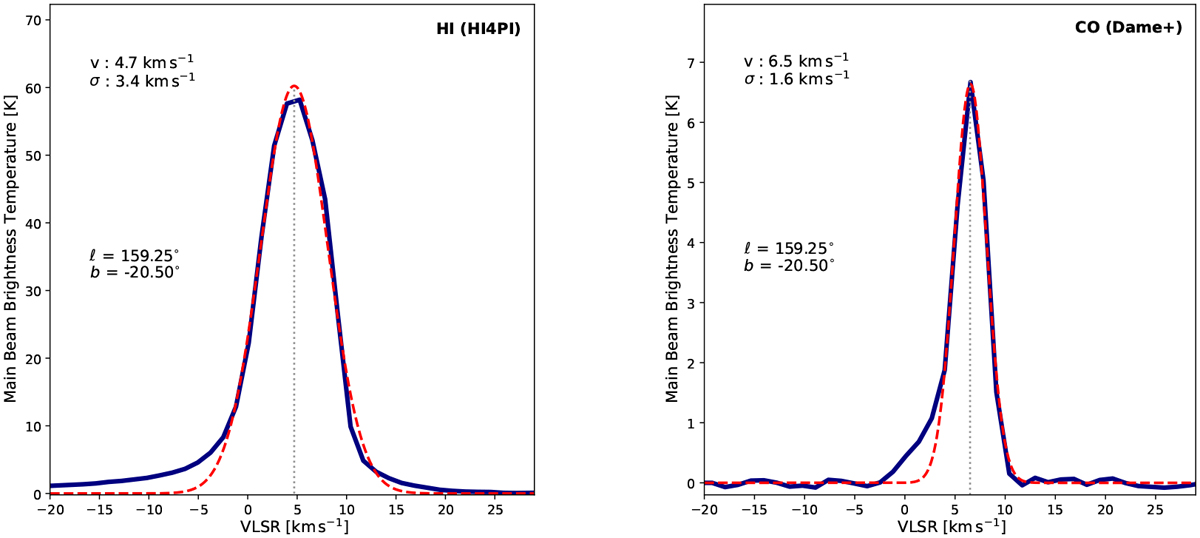
H I and CO spectra for the Perseus molecular cloud for one coordinate. The blue line shows the H I spectral line obtained from the HI4PI survey in the left panel and the observed 12CO 7(1−0) line obtained by Dame et al. (2001) in the right panel. The red line shows a Gaussian fit to each spectrum. The x axis shows the LSR velocity and the y axis shows the main-beam brightness temperature. In this work, we are interested in the peak emission by CO and H I averaged along the entire cloud.
Current usage metrics show cumulative count of Article Views (full-text article views including HTML views, PDF and ePub downloads, according to the available data) and Abstracts Views on Vision4Press platform.
Data correspond to usage on the plateform after 2015. The current usage metrics is available 48-96 hours after online publication and is updated daily on week days.
Initial download of the metrics may take a while.