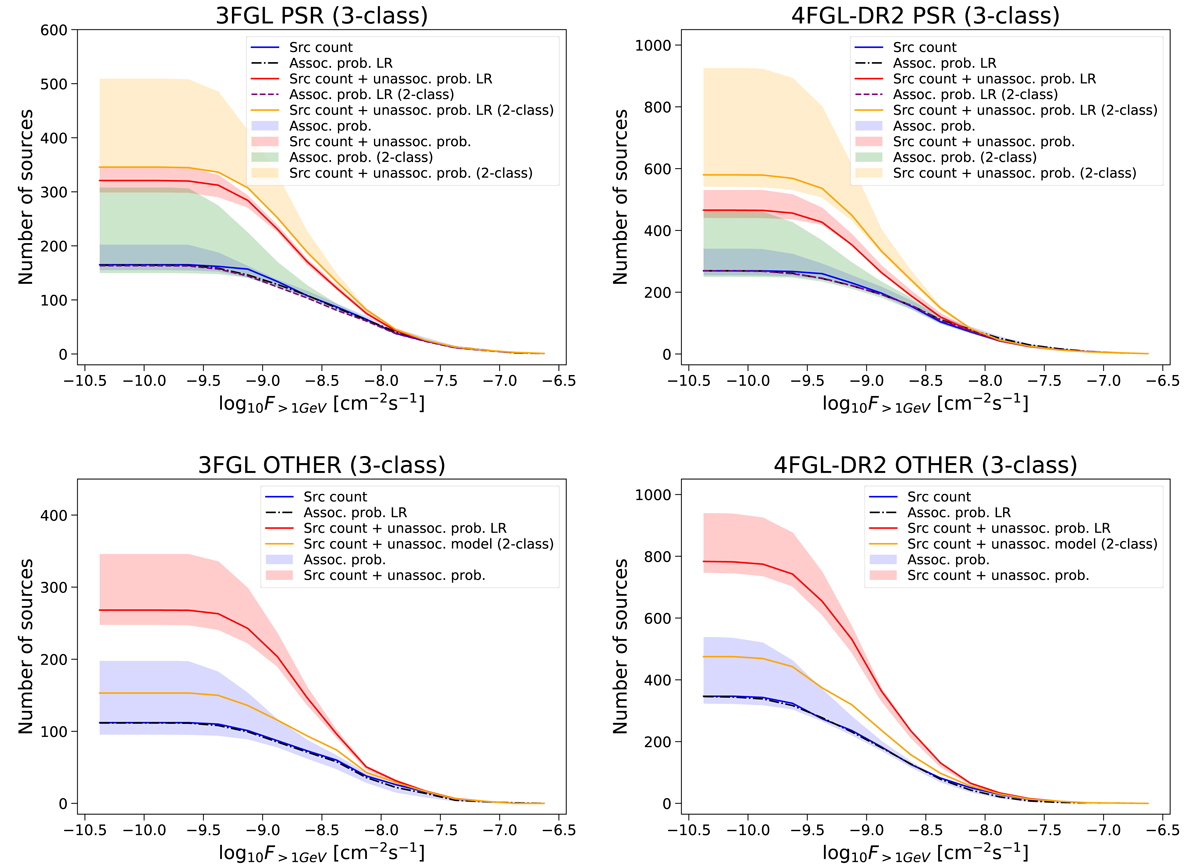
Fig. 19.
Download original image
Cumulative number of sources as a function of their flux. The solid blue lines represent the associated 3FGL and 4FGL-DR2 sources; the blue bands show the envelope of sums of class probabilities for associated sources for the eight ML methods; the purple dash-dotted lines show the sum of class probabilities for associated sources for the LR method without oversampling; the solid red lines (bands) show the sum of class probabilities for the LR model (the envelope of the eight ML methods) added to the source count of associated sources; the purple dashed lines show the sum of class probabilities for associated sources for the LR method without oversampling in the two-class classification corrected for the presence of OTHER sources; the solid orange lines (bands) show the sum of class probabilities for the LR model (the envelope of the eight ML methods), corrected for the presence of OTHER sources and added to the source count of associated sources (the band and the line are the same as in Fig. 18); green bands in the pulsar plots show the envelope of sums of class probabilities for associated sources for the eight ML methods in the two-class classification corrected for the presence of OTHER sources (the same as in Fig. 18); and solid orange lines in the OTHER plots show OTHER source counts plus an estimate of the number of OTHER sources among unassociated ones using Eq. (10) (for details, see Sect. 6.1).
Current usage metrics show cumulative count of Article Views (full-text article views including HTML views, PDF and ePub downloads, according to the available data) and Abstracts Views on Vision4Press platform.
Data correspond to usage on the plateform after 2015. The current usage metrics is available 48-96 hours after online publication and is updated daily on week days.
Initial download of the metrics may take a while.