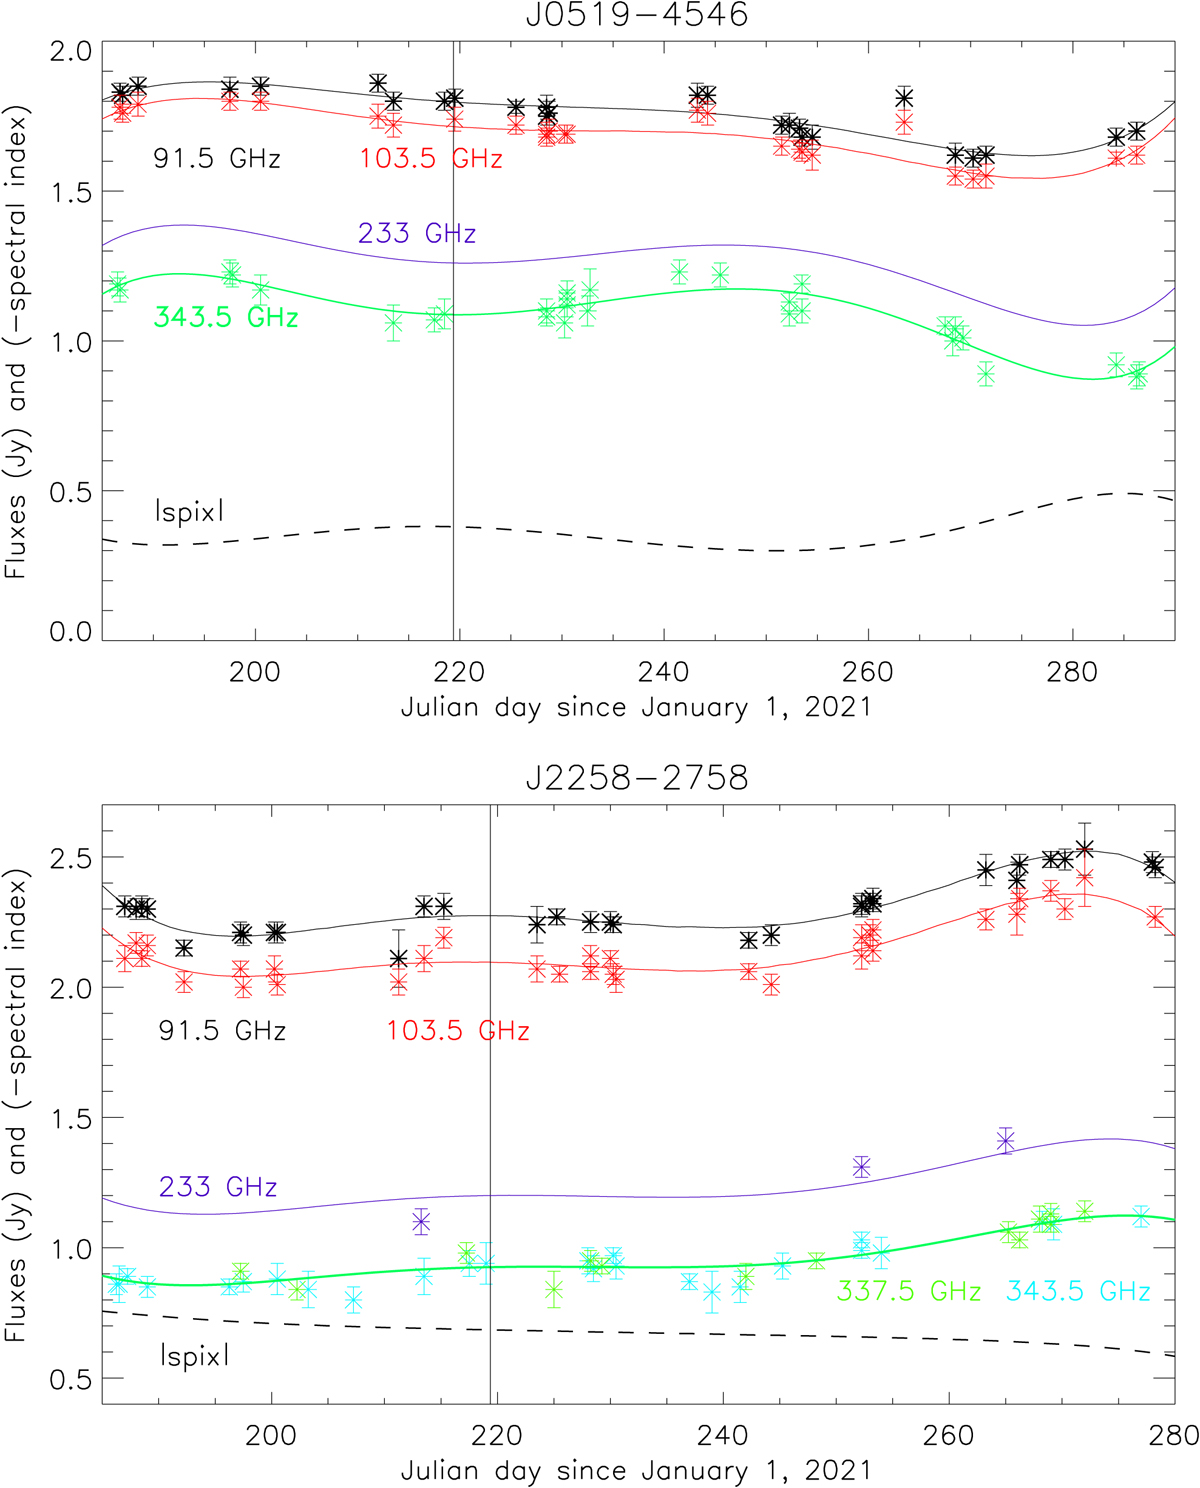
Fig. A.1.
Download original image
Flux measurements of the two flux (bandpass) calibrators over a period of ∼100 days that spans our observation period. These measurements, color-coded by frequency, are taken from the ALMA Calibrator Source Catalogue at 91.5, 103.5, and 337.5 or 343.5 GHz. The solid lines are polynomial fits, from which spectral indices and the 233 GHz flux as a function of time are inferred. In the case of J2258-2758, a few direct 233 GHz measurements are also available and plotted. The dashed line, labelled “|spix|,” shows the absolute value of the spectral index. The vertical bar corresponds to the date of the 2014 UN271 observations.
Current usage metrics show cumulative count of Article Views (full-text article views including HTML views, PDF and ePub downloads, according to the available data) and Abstracts Views on Vision4Press platform.
Data correspond to usage on the plateform after 2015. The current usage metrics is available 48-96 hours after online publication and is updated daily on week days.
Initial download of the metrics may take a while.