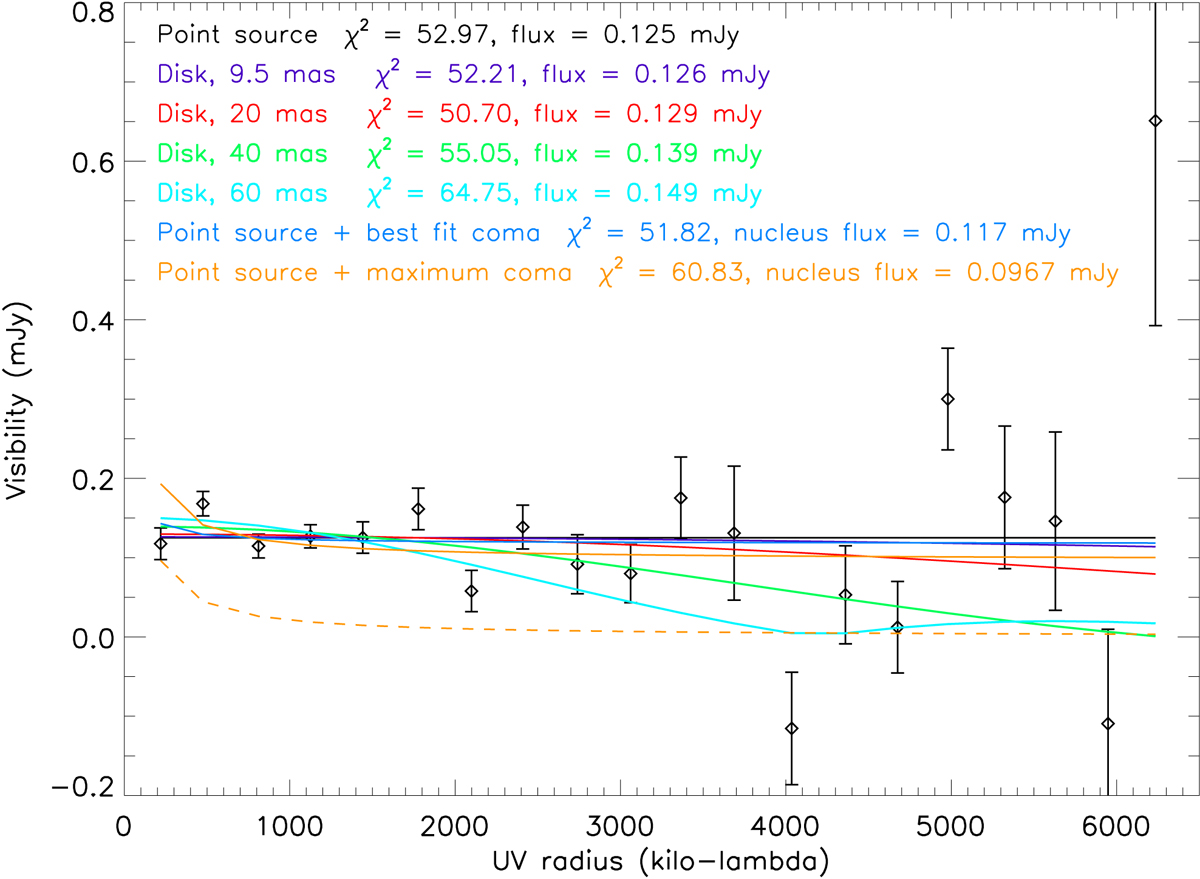
Fig. 2.
Download original image
Real part of the visibilities, averaged in 400-meter UV radius bins, compared to various models: (i) point source, (ii) disks with apparent sizes of 9.5, 20, 40, and 60 mas, and (iii) sum of a point source and a coma. The visibilities are rescaled to 233 GHz, and the UV radii are expressed in terms of the wavelength (kilo-λ). The dashed orange curve indicates the strongest coma signal that can be accommodated by the data.
Current usage metrics show cumulative count of Article Views (full-text article views including HTML views, PDF and ePub downloads, according to the available data) and Abstracts Views on Vision4Press platform.
Data correspond to usage on the plateform after 2015. The current usage metrics is available 48-96 hours after online publication and is updated daily on week days.
Initial download of the metrics may take a while.