Fig. A.1
Download original image
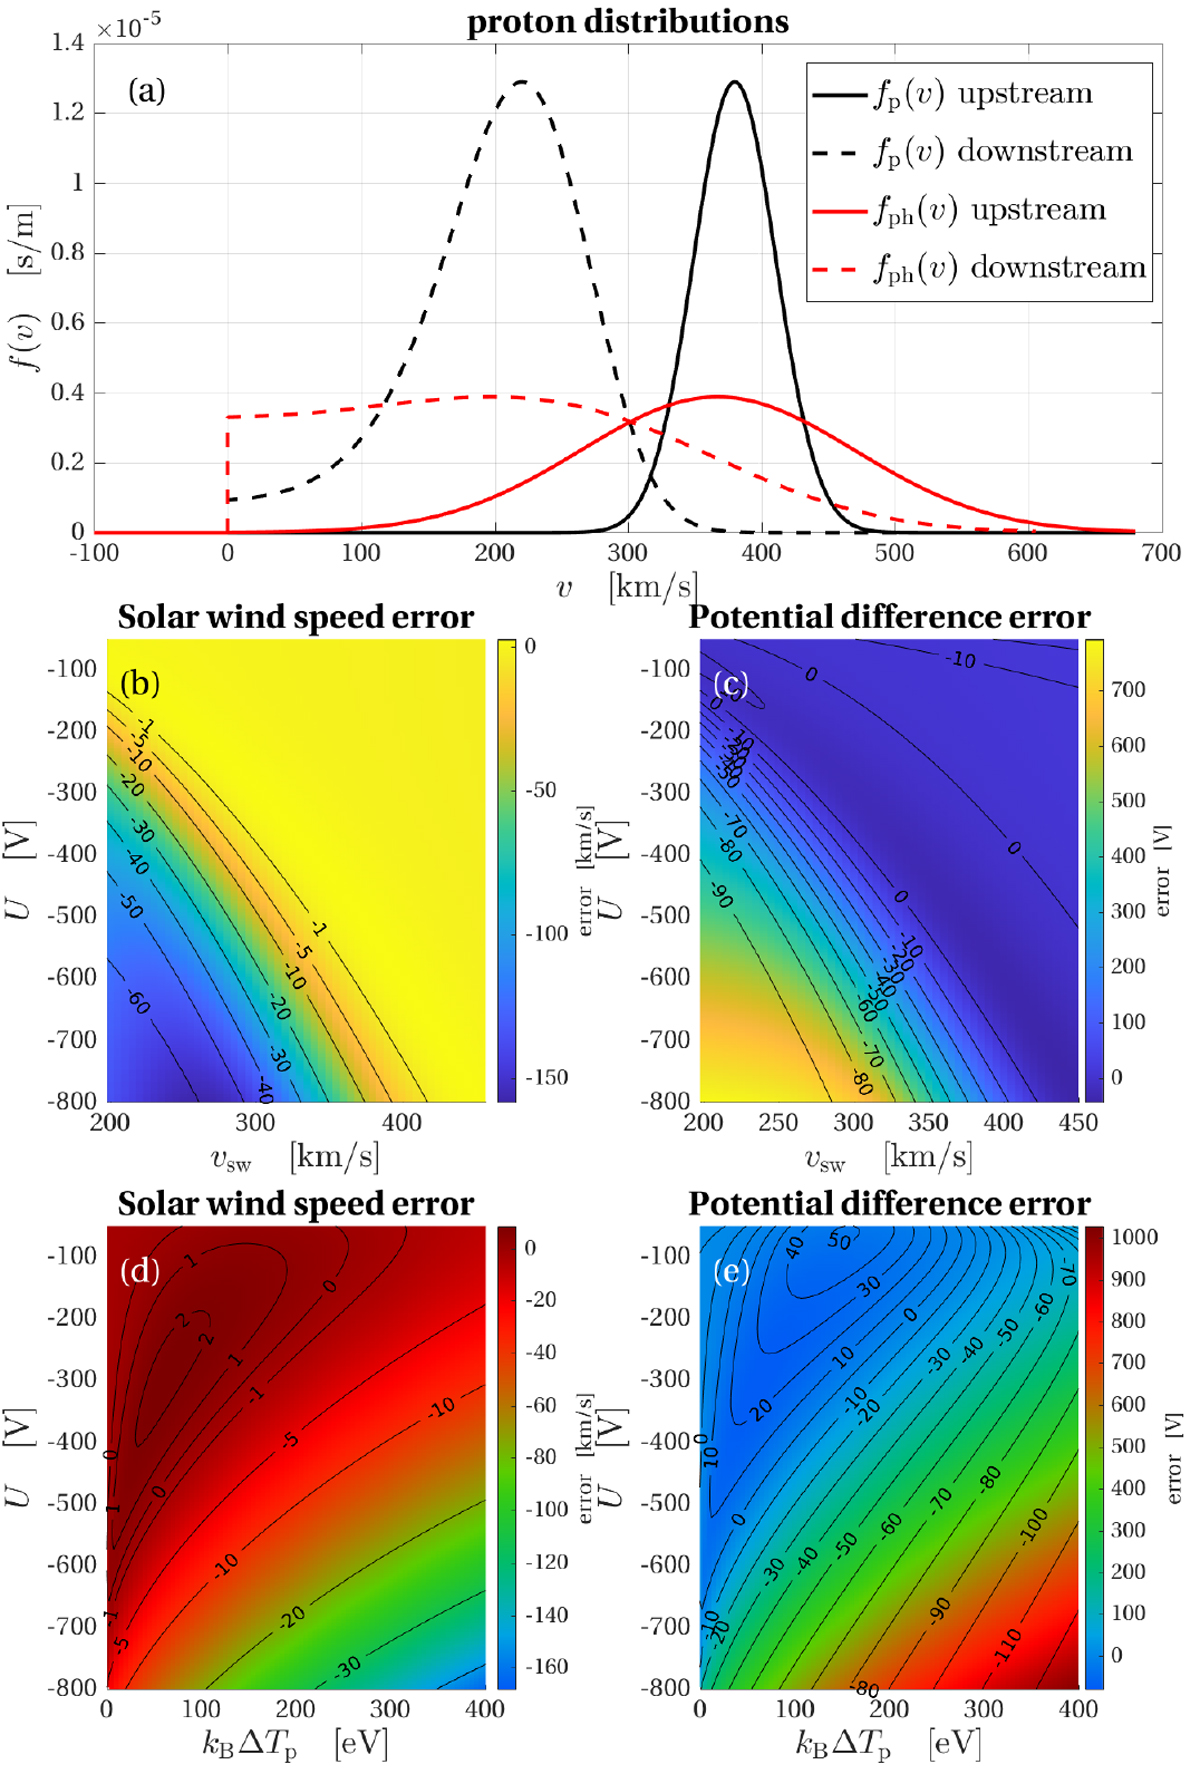
Error estimates for distributions with non-zero temperatures and for distributions subjected to heating. (a) Proton distribution functions: Upstream 10 eV distribution, drifting at 380 km s−1 (solid black line); the same population downstream at U = −500 V (dashed black line); the upstream population heated by 100 eV (solid red line); and the same population downstream of the potential drop (dashed red line). (b) solar wind speed error due to non-zero upstream temperatures. (c) potential difference error due to non-zero upstream temperatures. (d) solar wind speed error due to heating. (e) potential difference error due to heating. In panels b–d, the absolute error is colour-coded, and the relative error, expressed as a percentage, is shown by overlaid contours.
Current usage metrics show cumulative count of Article Views (full-text article views including HTML views, PDF and ePub downloads, according to the available data) and Abstracts Views on Vision4Press platform.
Data correspond to usage on the plateform after 2015. The current usage metrics is available 48-96 hours after online publication and is updated daily on week days.
Initial download of the metrics may take a while.