Fig. 6
Download original image
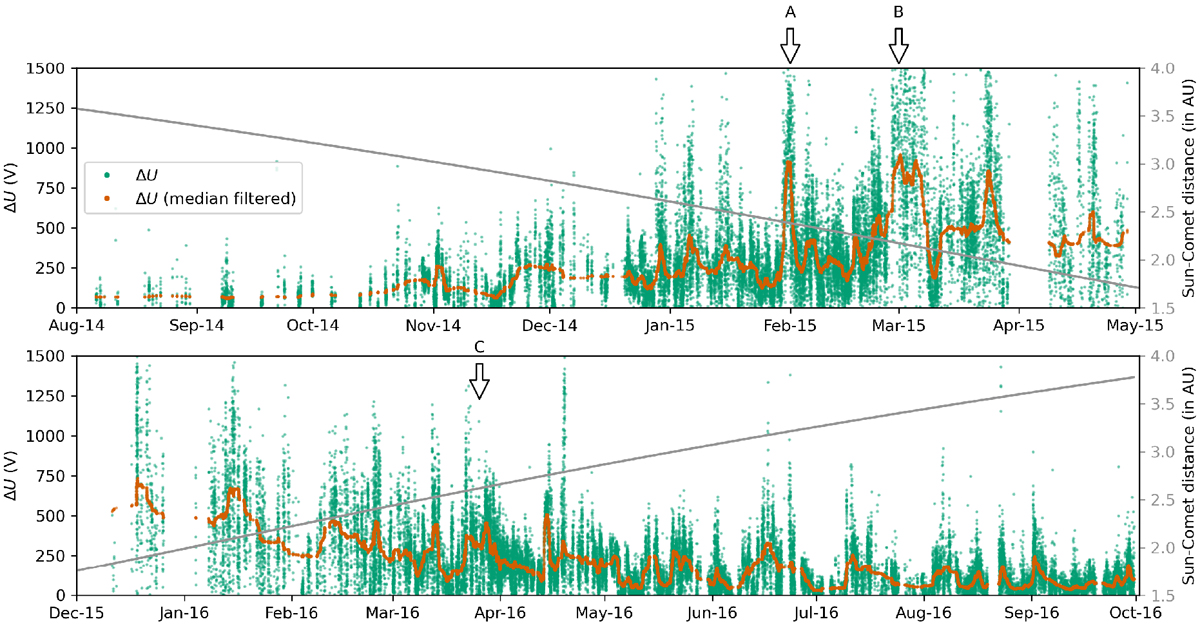
Electric potential difference between the upstream solar wind and the observation point (V) as a function of time before the solar wind ion cavity (top) and after the solar wind ion cavity (bottom). Green dots show individual data points. The orange line shows the same data filtered using a 400-point running median filter. Arrows marked A, B, and C indicate the cases discussed in Sect. 4.6. The grey line shows the comet-Sun distance in AU.
Current usage metrics show cumulative count of Article Views (full-text article views including HTML views, PDF and ePub downloads, according to the available data) and Abstracts Views on Vision4Press platform.
Data correspond to usage on the plateform after 2015. The current usage metrics is available 48-96 hours after online publication and is updated daily on week days.
Initial download of the metrics may take a while.