Fig. 2
Download original image
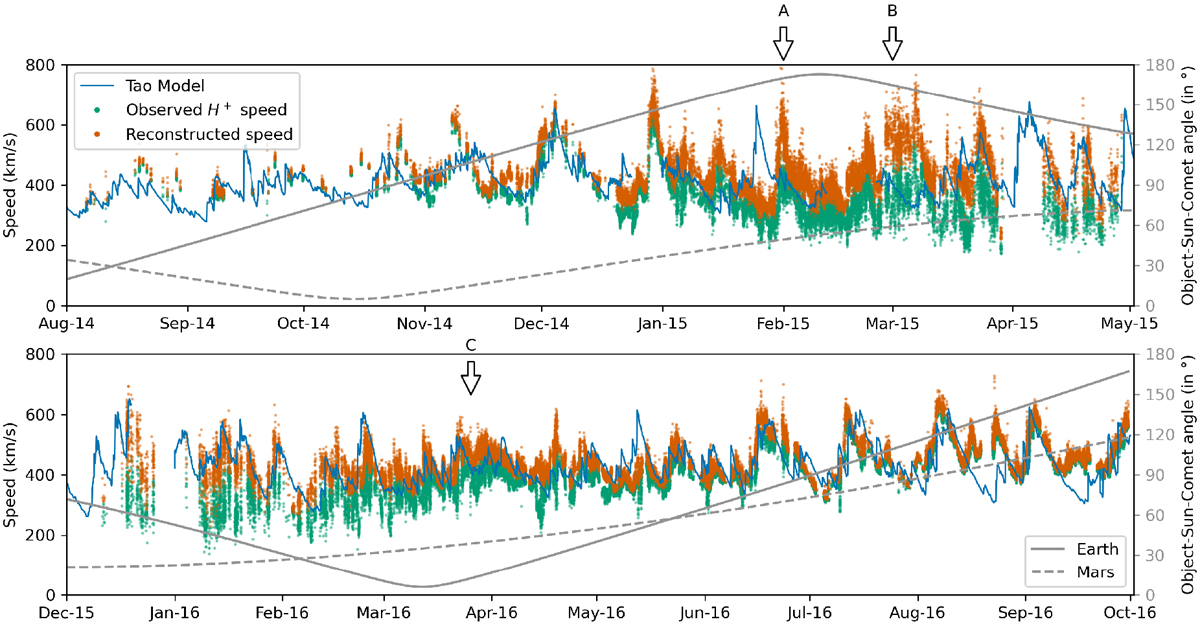
Proton speed from the Tao model (blue line), from observed ICA measurements (green dots), and reconstructed using our method (orange dots), km s−1, left scale. The Earth – Sun – Comet angle is shown with a grey line, and the Mars – Sun – comet angle is plotted with a dashed grey line, right scale. Arrows marked A, B, and C indicate the cases discussed in Sect. 4.6.
Current usage metrics show cumulative count of Article Views (full-text article views including HTML views, PDF and ePub downloads, according to the available data) and Abstracts Views on Vision4Press platform.
Data correspond to usage on the plateform after 2015. The current usage metrics is available 48-96 hours after online publication and is updated daily on week days.
Initial download of the metrics may take a while.