Open Access
Fig. 1
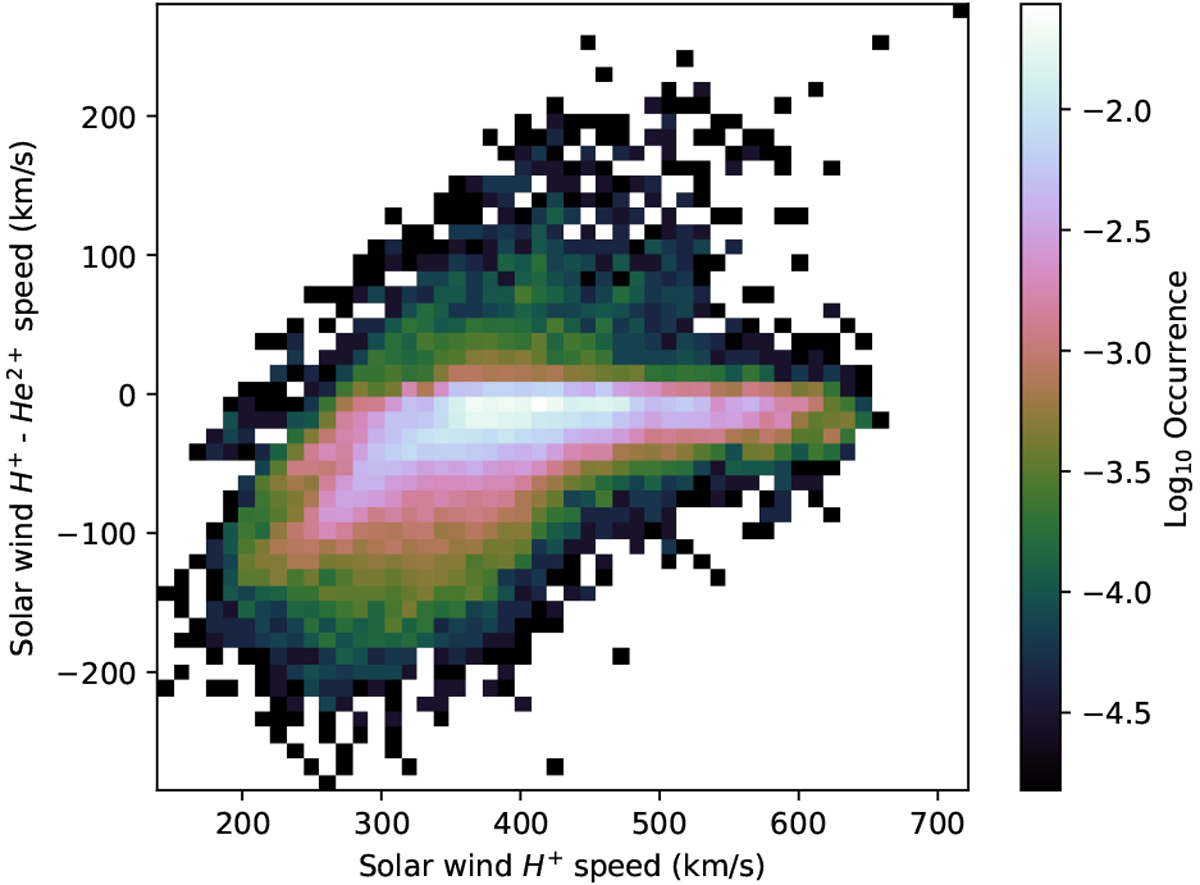
Download original image
Rosetta observations of the difference between the H+ speed and the He2+ (y-axis, km s−1) speed as a function of the H+ speed (x-axis km s−1). The colour scale shows the logarithm of the occurrence frequency.
Current usage metrics show cumulative count of Article Views (full-text article views including HTML views, PDF and ePub downloads, according to the available data) and Abstracts Views on Vision4Press platform.
Data correspond to usage on the plateform after 2015. The current usage metrics is available 48-96 hours after online publication and is updated daily on week days.
Initial download of the metrics may take a while.