Free Access
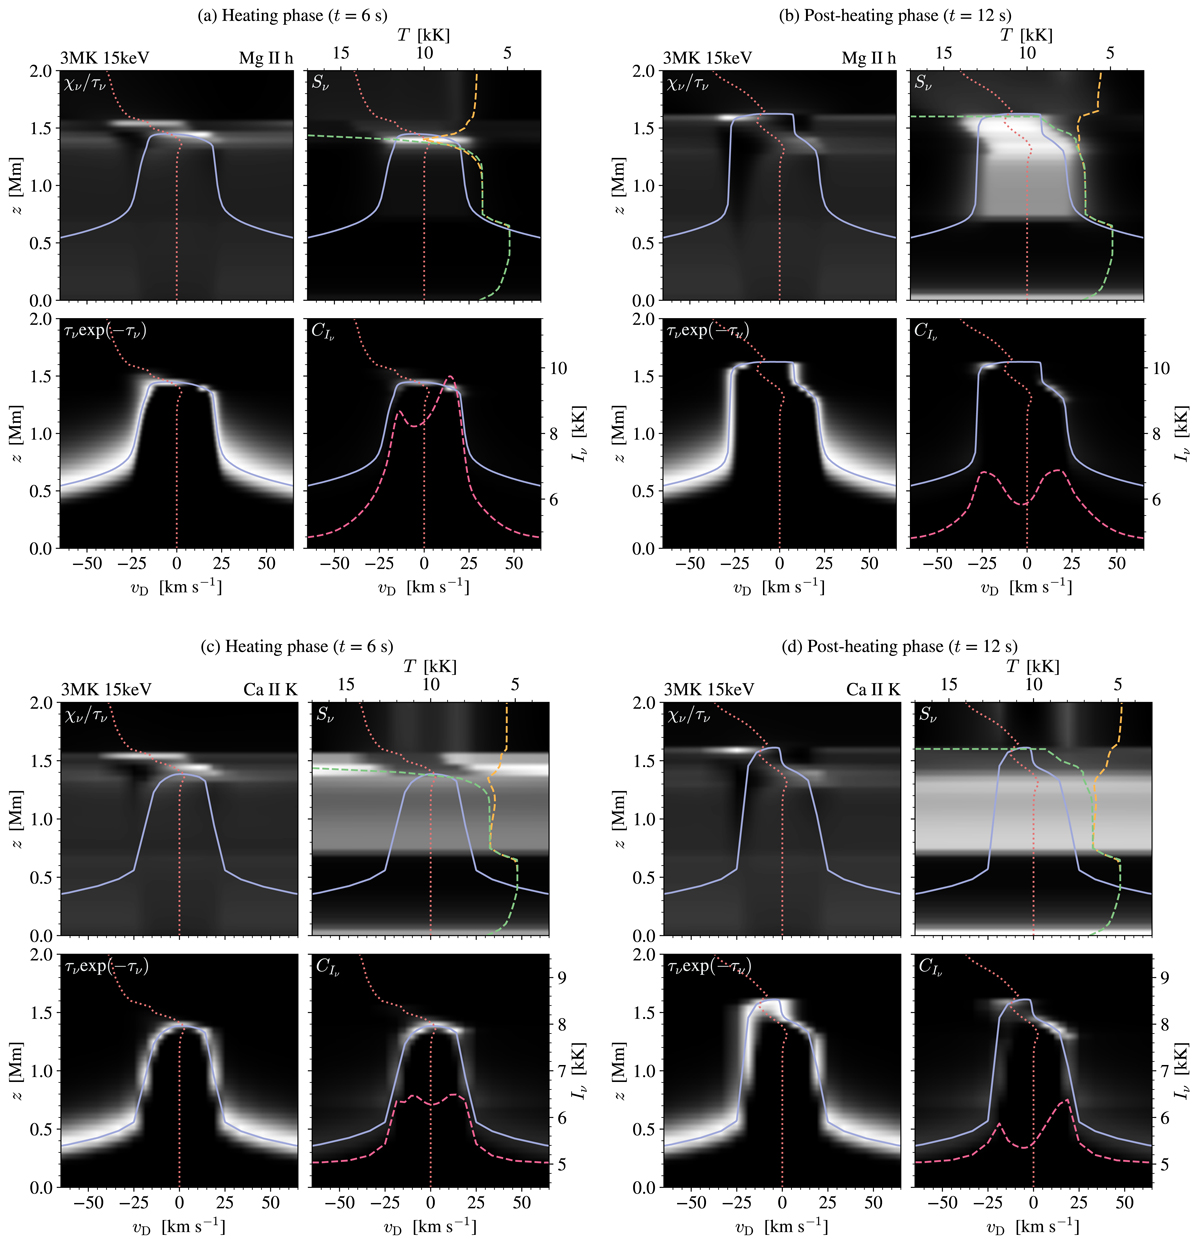
Fig. 9.
Download original image
Intensity formation of the Mg II h (top) and Ca II K (bottom) spectral lines from the 15 keV dense loop model. We note the different scaling of the brightness temperature in the top and bottom panels. See the caption of Fig. 8 for more details.
Current usage metrics show cumulative count of Article Views (full-text article views including HTML views, PDF and ePub downloads, according to the available data) and Abstracts Views on Vision4Press platform.
Data correspond to usage on the plateform after 2015. The current usage metrics is available 48-96 hours after online publication and is updated daily on week days.
Initial download of the metrics may take a while.