Fig. 8.
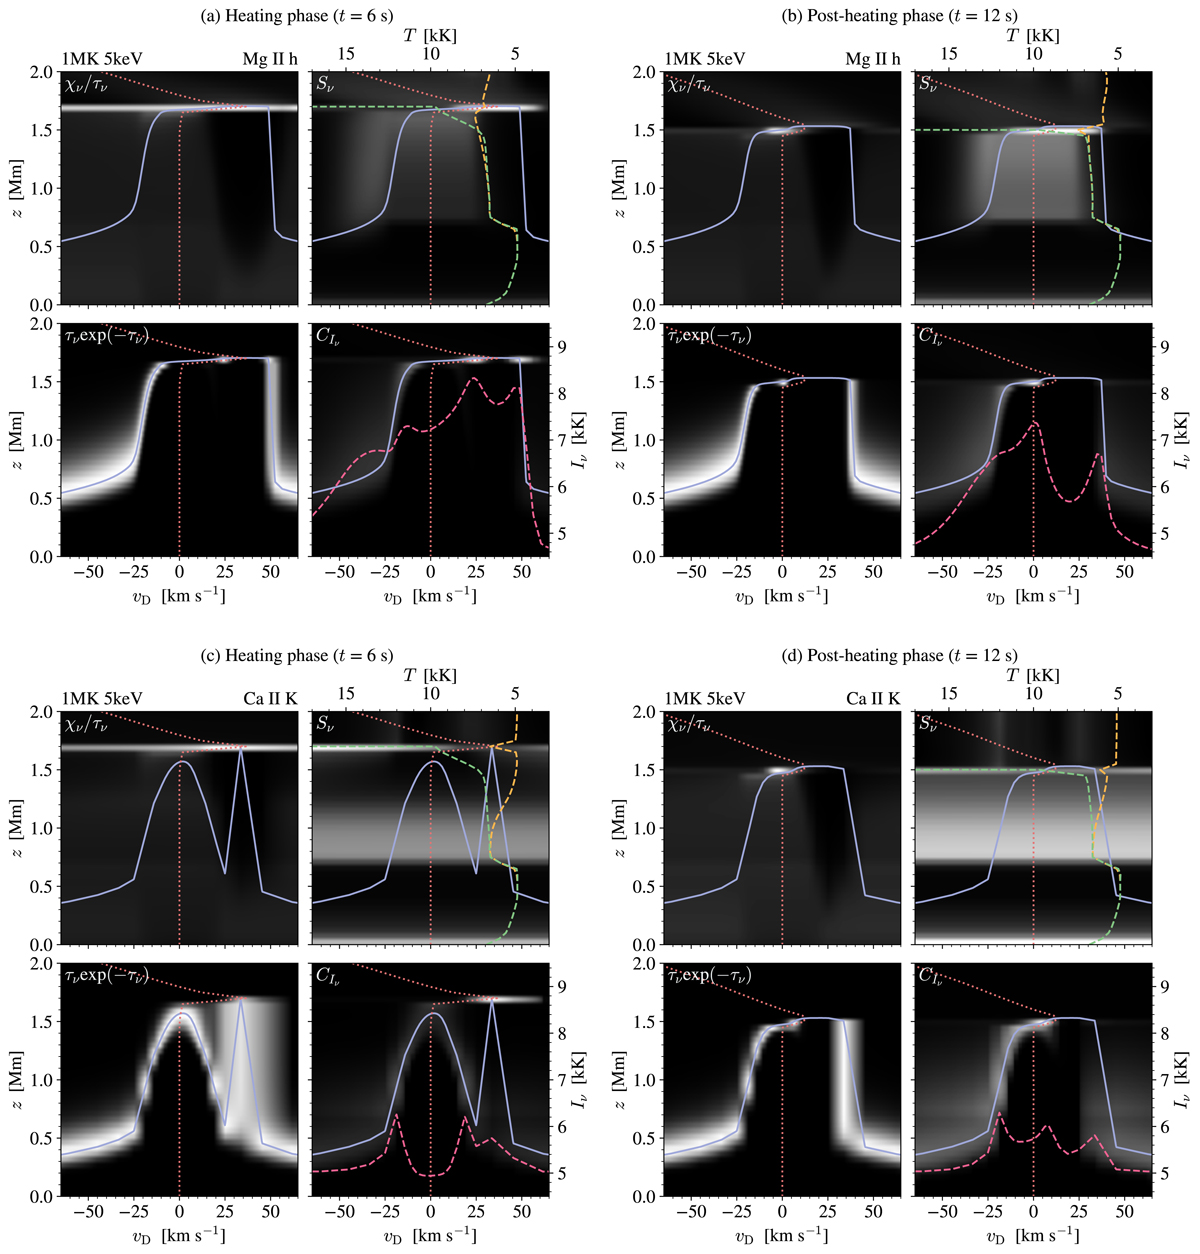
Download original image
Intensity formation of the Mg II h (top) and Ca II K (bottom) spectral lines from the 5 keV empty loop model. The subfigures show the heating phase ((a) and (c)) and early post-heating phase ((b) and (d)) for the two lines. The quantities given at the top left corner are shown in greyscale as functions of frequency from line centre (in units of Doppler offset) and height z. The τν = 1 height (purple) and vertical velocity (red dotted) are displayed in all panels. Negative (positive) velocities correspond to upflows (downflows). In addition, the top right panels show the total source function at vD = 0 (yellow dashed) and Planck function (green dashed) in units of brightness temperature, with high values to the left. The bottom right panels also contain the intensity profile (pink) as brightness temperature. Gamma correction is added to the χν/τν and CIν terms to amplify the weaker signals.
Current usage metrics show cumulative count of Article Views (full-text article views including HTML views, PDF and ePub downloads, according to the available data) and Abstracts Views on Vision4Press platform.
Data correspond to usage on the plateform after 2015. The current usage metrics is available 48-96 hours after online publication and is updated daily on week days.
Initial download of the metrics may take a while.