Fig. 4.
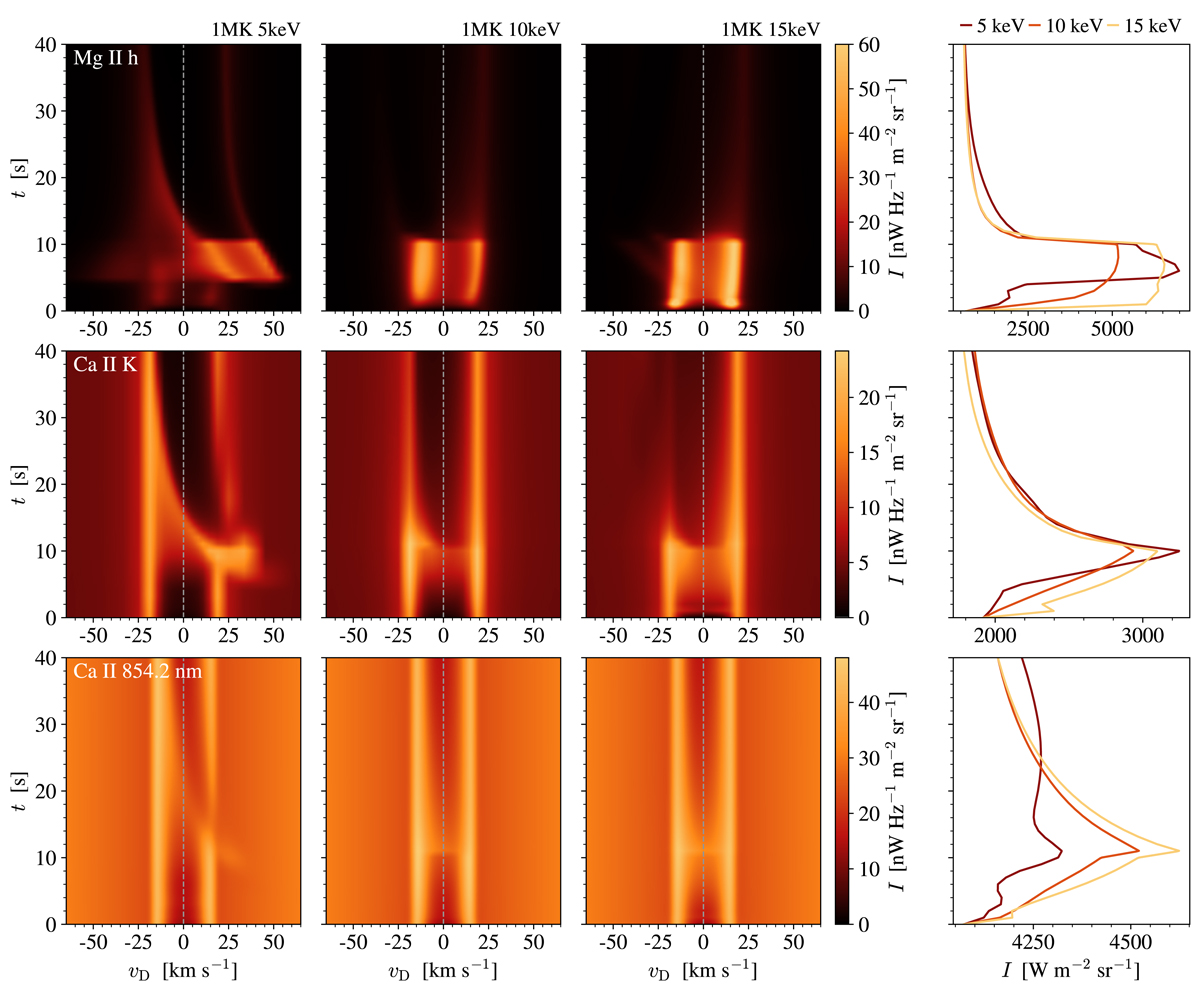
Download original image
Spectral evolution of Mg II h, Ca II K, and Ca II 854.2 nm spectra for the heating models with TLT = 1 MK and EC = 5, 10, and 15 keV. The x-axes in the first three panels of each row are in units of Doppler offset, where negative (positive) velocities indicate blueshifts (redshifts). The panels of the right column show light curves from each heating model, where the x-axes are in units of integrated intensity. The first 40 s of the simulations are shown, including the 10 s electron injection phase. The Mg II h spectra are clipped at 60 nW Hz−1 m−2 sr−1 to emphasise the less bright features. Line profiles for t = 0, 7, and 15 s are shown in Fig. 6.
Current usage metrics show cumulative count of Article Views (full-text article views including HTML views, PDF and ePub downloads, according to the available data) and Abstracts Views on Vision4Press platform.
Data correspond to usage on the plateform after 2015. The current usage metrics is available 48-96 hours after online publication and is updated daily on week days.
Initial download of the metrics may take a while.