Fig. 2.
Download original image
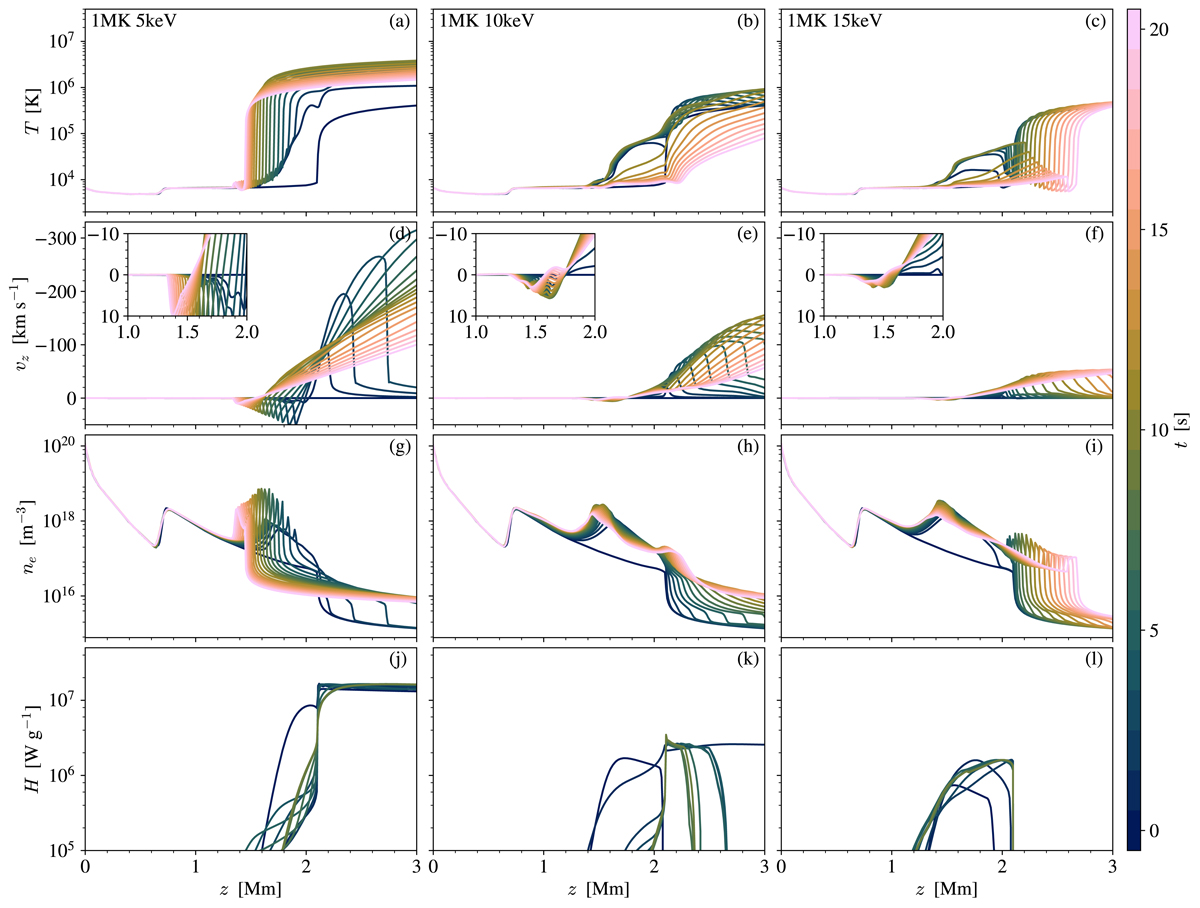
Atmospheric response to the RADYN simulation for the 15 Mm half-loop with initial apex temperature of 1 MK. Each column corresponds to the heating model with EC = 5, 10, and 15 keV, and each row represents the temperature, velocity, electron number density, and beam heating rate. Negative (positive) velocities correspond to upflows (downflows). The quantities are plotted in the range z ∈ [0, 3] Mm at 1 s intervals. Temperature, velocity, and electron number density are displayed for the first 20 s of the simulations, while the beam heating rate is given for the duration of the injected electron beam (10 s). The insets in panels d–f show the velocity in the region z = 1–2 Mm saturated to ±10 km s−1.
Current usage metrics show cumulative count of Article Views (full-text article views including HTML views, PDF and ePub downloads, according to the available data) and Abstracts Views on Vision4Press platform.
Data correspond to usage on the plateform after 2015. The current usage metrics is available 48-96 hours after online publication and is updated daily on week days.
Initial download of the metrics may take a while.