Free Access
Fig. 17
Download original image
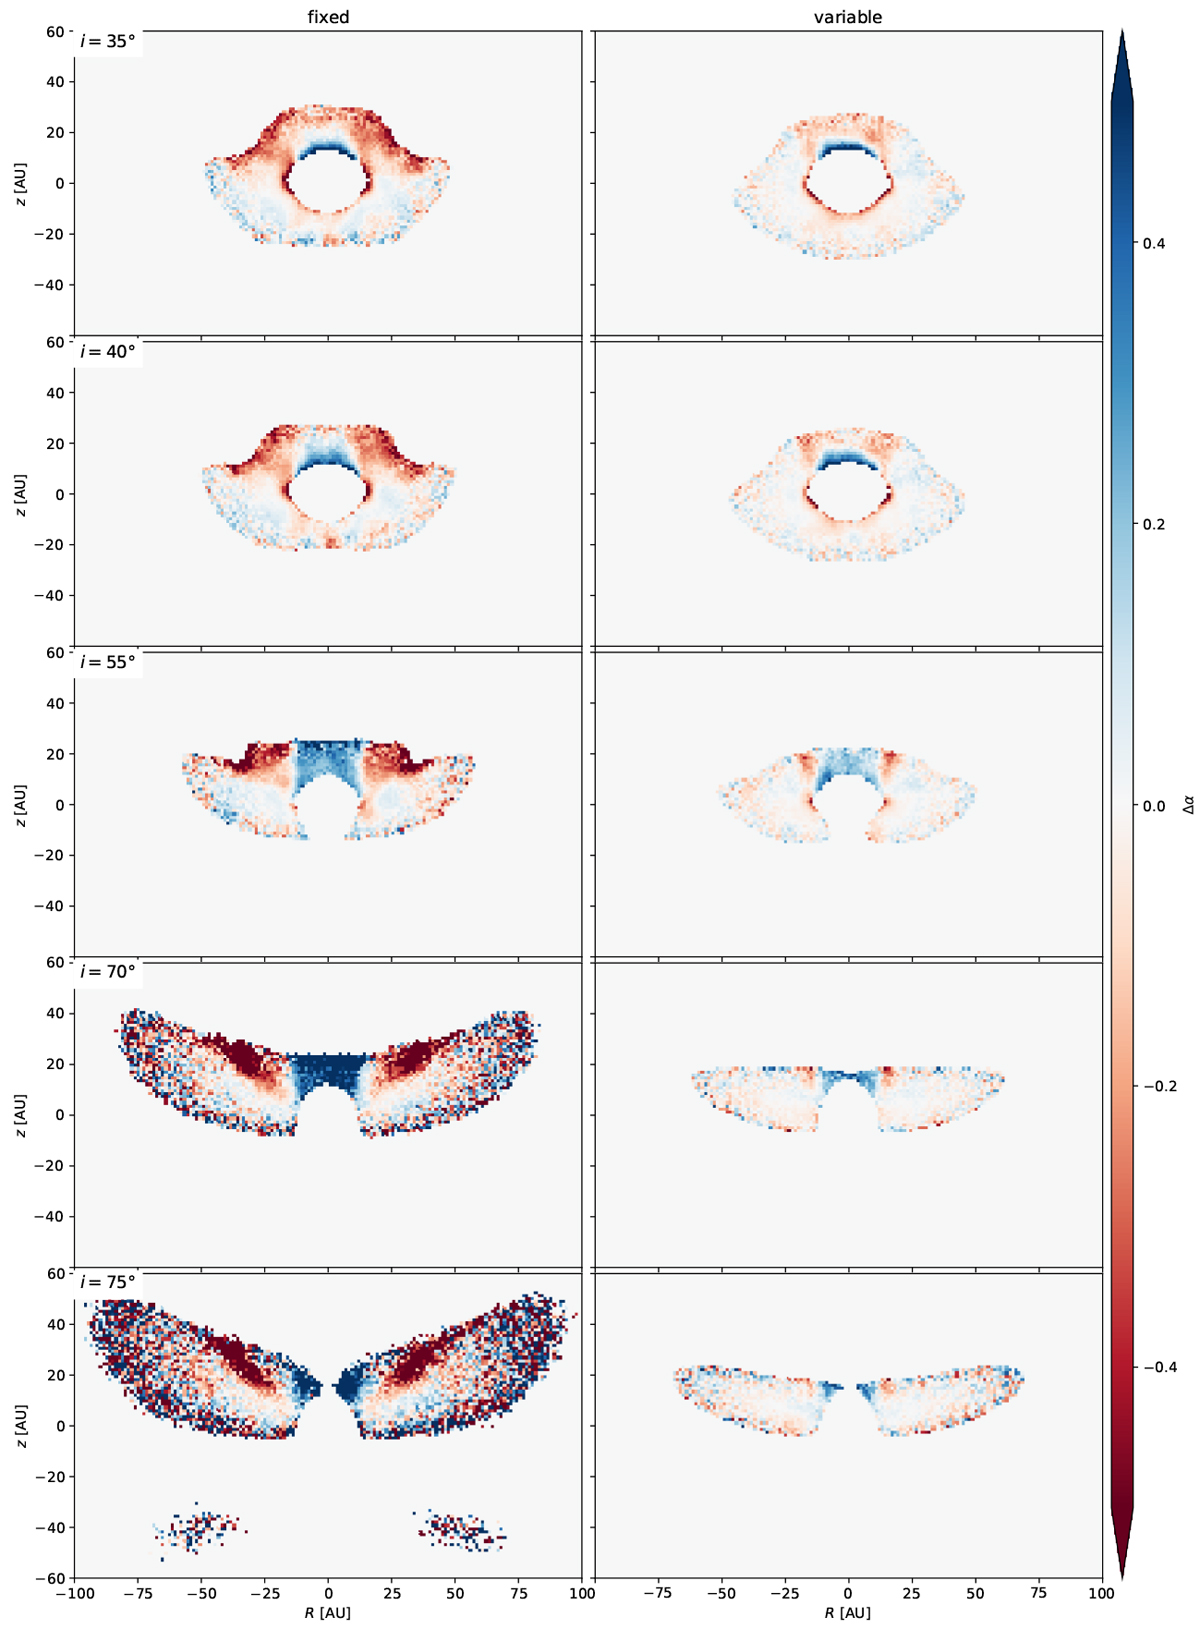
Difference Δα between the spectral indices αJ,H of the ‘wind’ and ‘no wind’ models for fixTD20 (left) and varTD20 (right); plots for the individual α values are provided in Appendix B. For intermediate inclinations (35° ≲ i ≲ 75°), the dusty wind causes a clear colour excess, which appears particularly blue above the star.
Current usage metrics show cumulative count of Article Views (full-text article views including HTML views, PDF and ePub downloads, according to the available data) and Abstracts Views on Vision4Press platform.
Data correspond to usage on the plateform after 2015. The current usage metrics is available 48-96 hours after online publication and is updated daily on week days.
Initial download of the metrics may take a while.