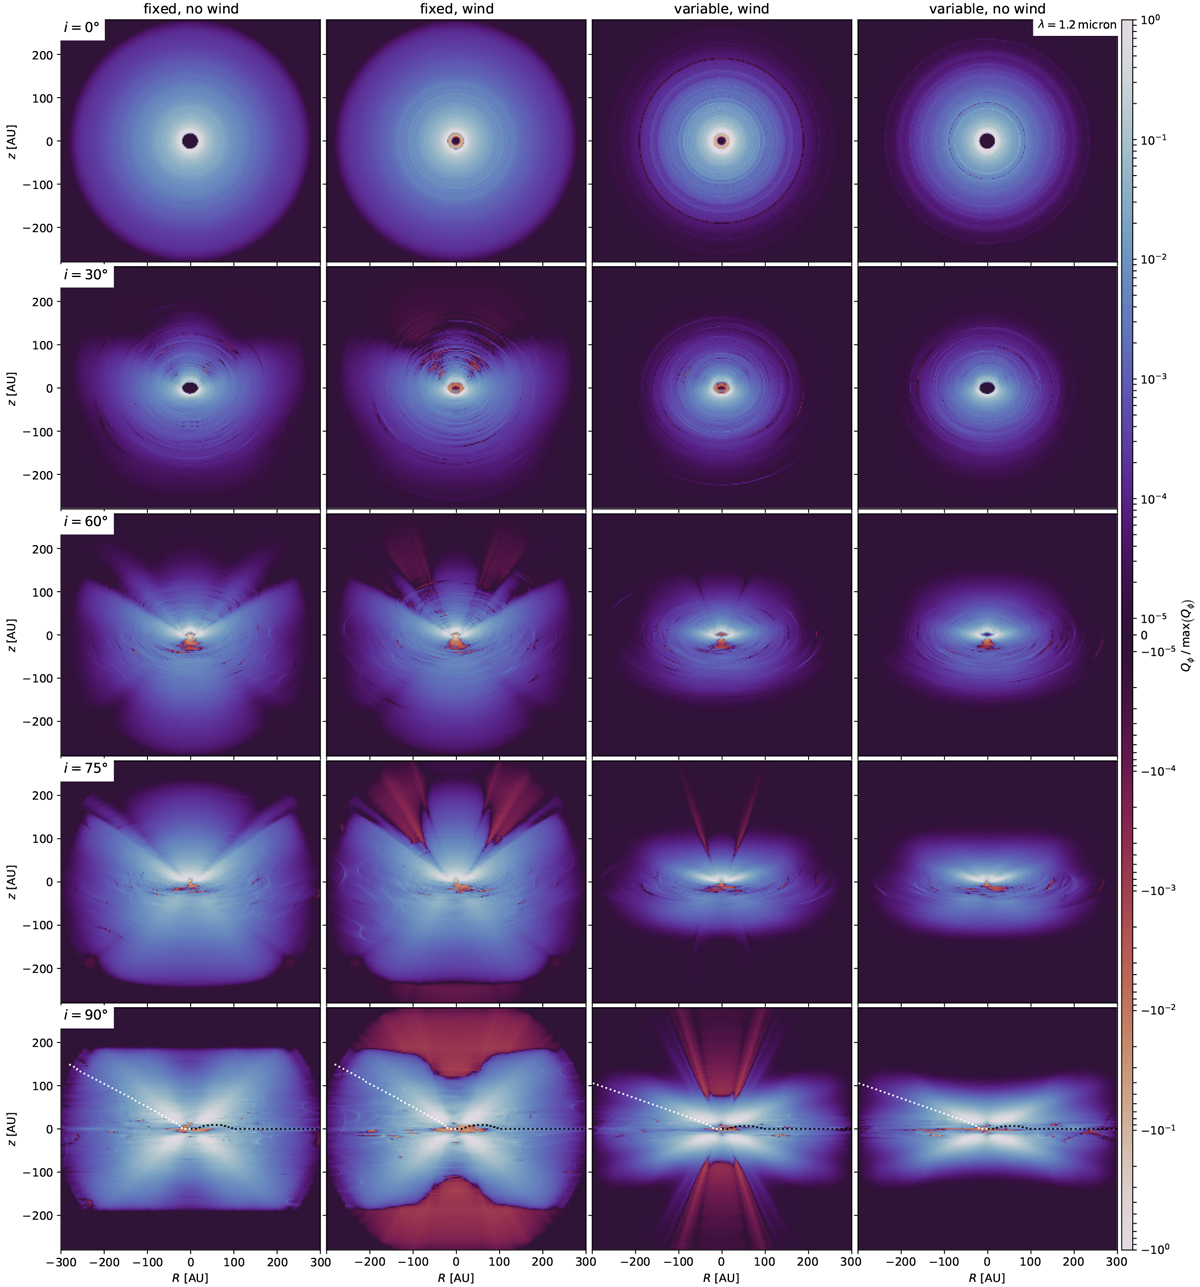
Fig. 13
Download original image
Polarised-light Qϕ for λobs= 1.2 μm for TD20.While the layout of the rows (inclinations) and columns (models) is the same as for the scattered-light images, no artificial coronagraph is applied. The dotted white (black) line indicates the (τ = 1)-surface as seen from r = 0 (z = ∞). The wind produces a distinct signature especially around the jet region.
Current usage metrics show cumulative count of Article Views (full-text article views including HTML views, PDF and ePub downloads, according to the available data) and Abstracts Views on Vision4Press platform.
Data correspond to usage on the plateform after 2015. The current usage metrics is available 48-96 hours after online publication and is updated daily on week days.
Initial download of the metrics may take a while.