Free Access
Fig. 8.
Download original image
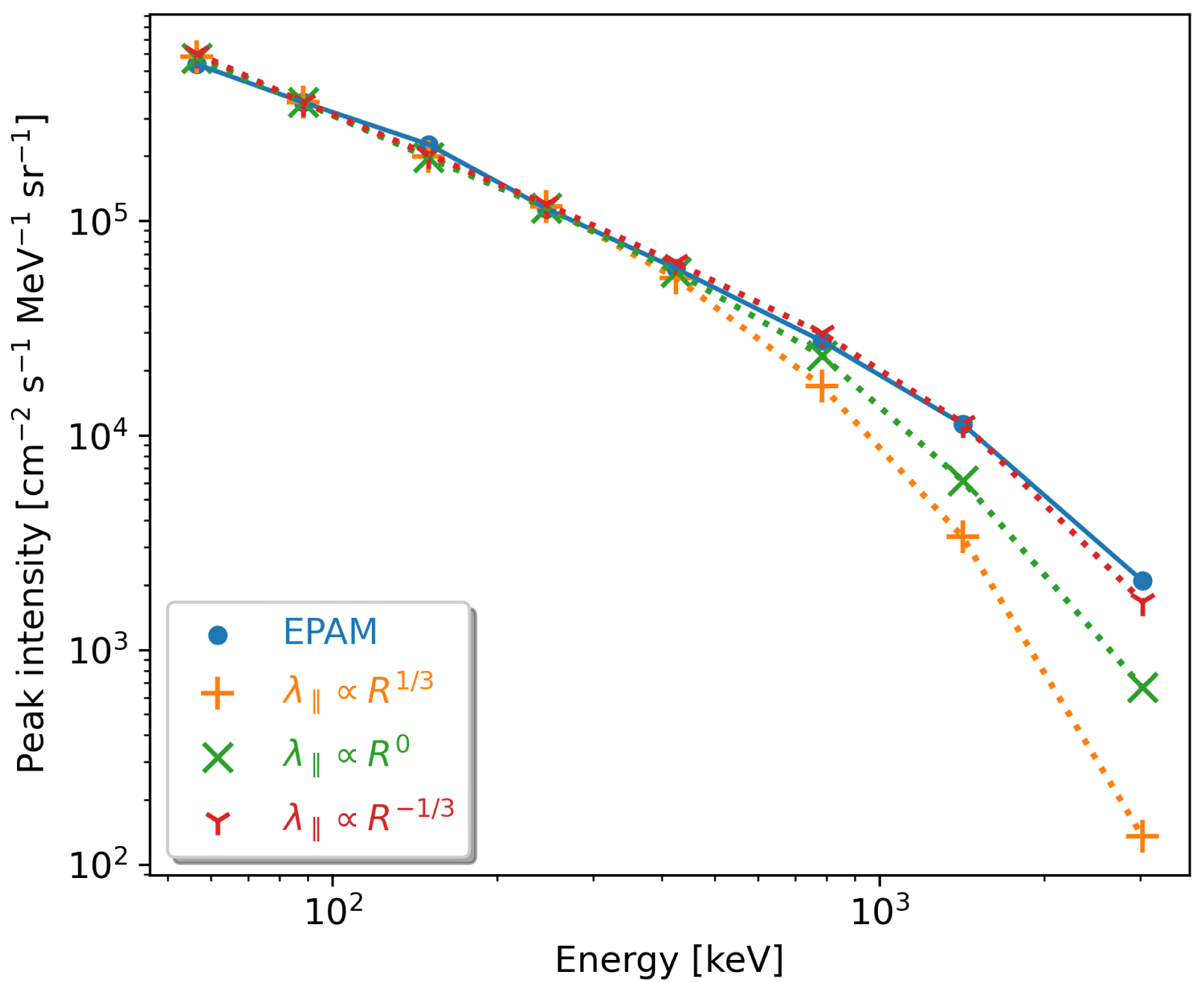
Peak intensity energy spectra obtained from different λ∥ power-law dependences on the ion rigidity. The orange, green, and red symbols give the results of PARADISE simulations using the indicated rigidity dependence. Blue symbols give the peak intensities measured by EPAM.
Current usage metrics show cumulative count of Article Views (full-text article views including HTML views, PDF and ePub downloads, according to the available data) and Abstracts Views on Vision4Press platform.
Data correspond to usage on the plateform after 2015. The current usage metrics is available 48-96 hours after online publication and is updated daily on week days.
Initial download of the metrics may take a while.