Fig. 4.
Download original image
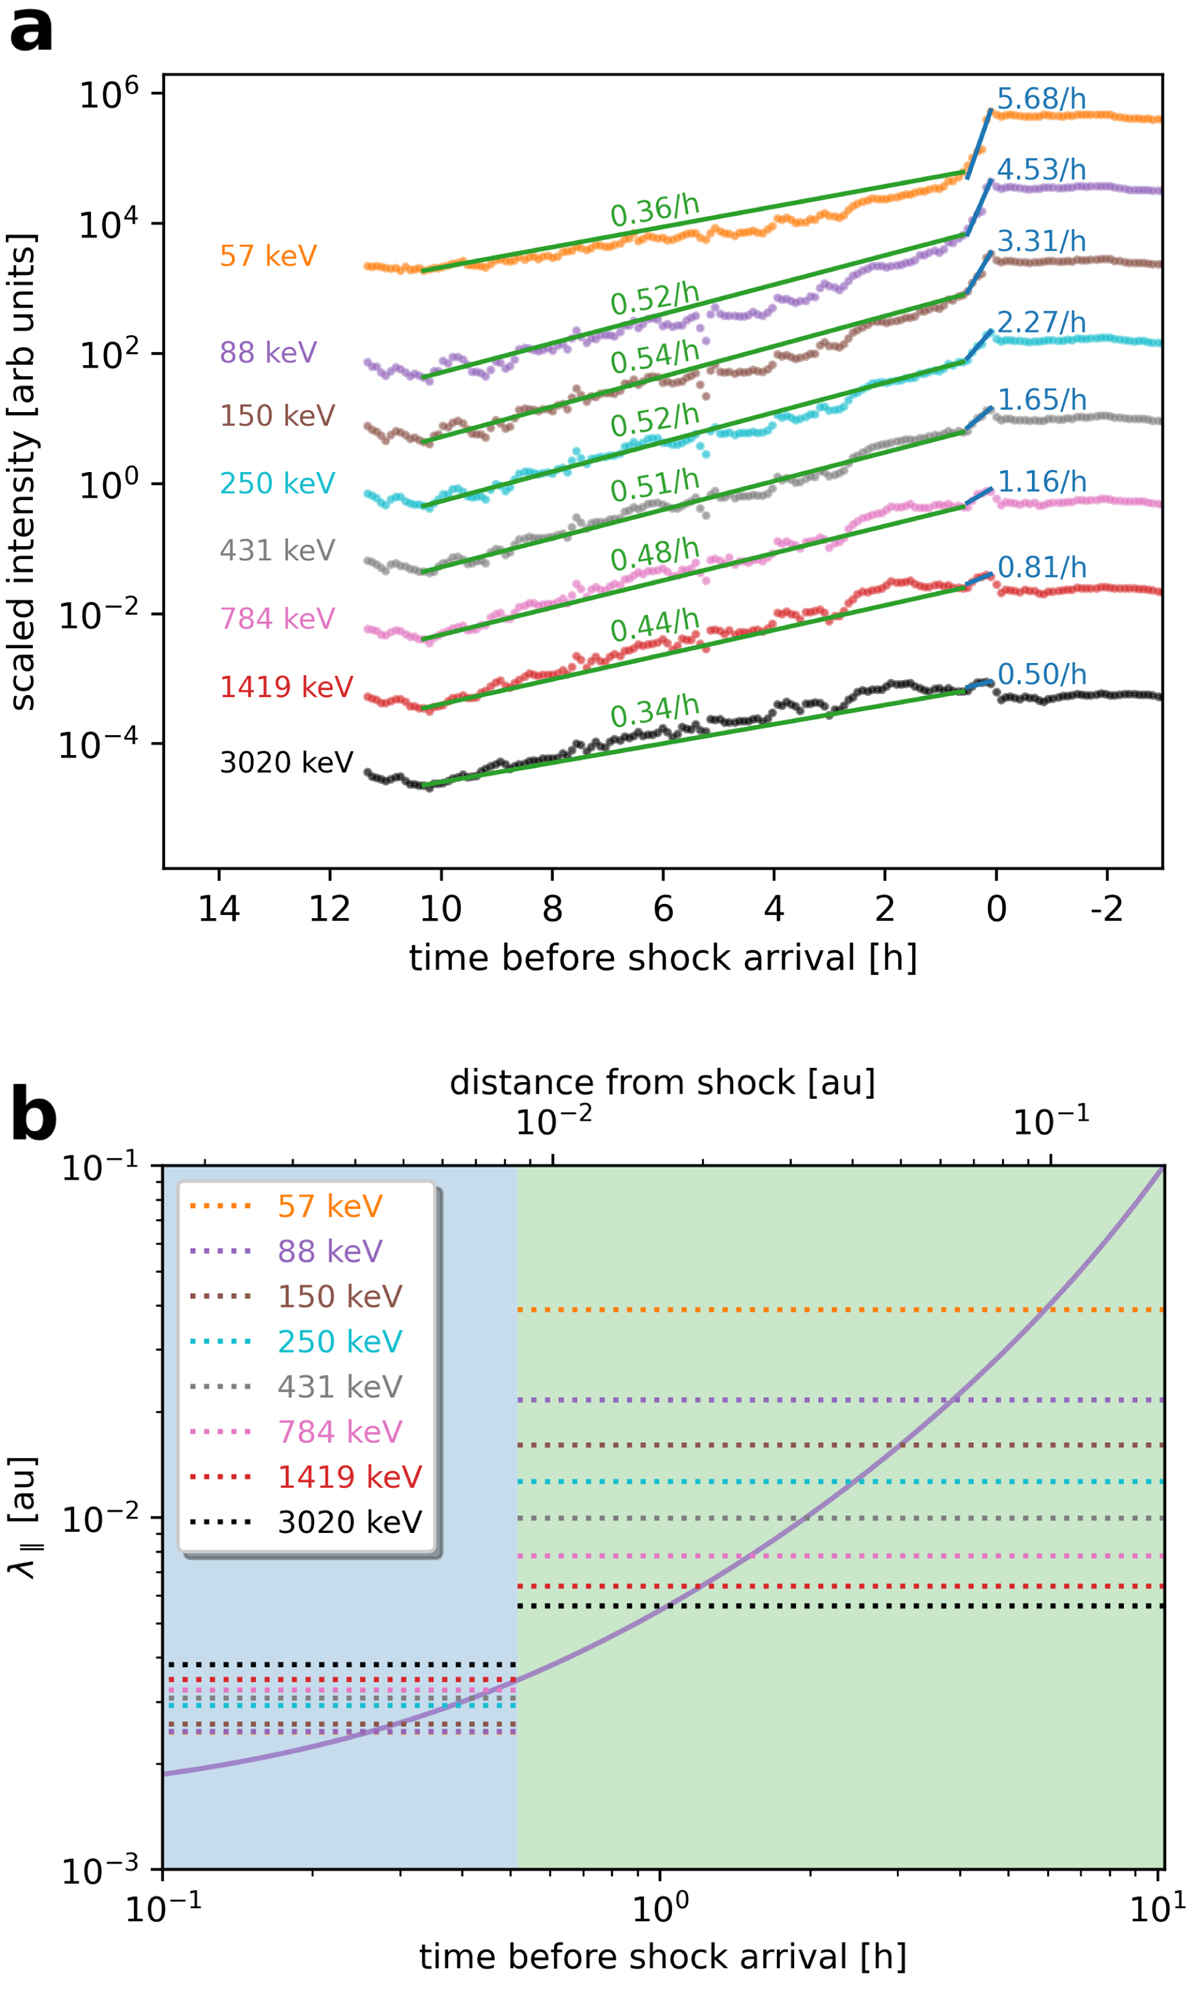
Parallel mean free path in the foreshock derived from in situ ion intensity measurements. Panel a: dots give the intensity-time profiles observed by EPAM for different energy channels, shifted downwards to avoid overlap. The straight lines give a time-averaged increase in the time intervals T1 = [0 h, 0.5 h] (blue) and T2 = [0.5 h, 10.3 h] (green), and the values above each line give the slope. Panel b: the dotted lines give the ![]() derived from the slopes presented in (a) for T1 (blue background) and T2 (green background). The solid line gives the f(s) (see Eq. (7)) used in the PARADISE simulations.
derived from the slopes presented in (a) for T1 (blue background) and T2 (green background). The solid line gives the f(s) (see Eq. (7)) used in the PARADISE simulations.
Current usage metrics show cumulative count of Article Views (full-text article views including HTML views, PDF and ePub downloads, according to the available data) and Abstracts Views on Vision4Press platform.
Data correspond to usage on the plateform after 2015. The current usage metrics is available 48-96 hours after online publication and is updated daily on week days.
Initial download of the metrics may take a while.