Free Access
Fig. 2.
Download original image
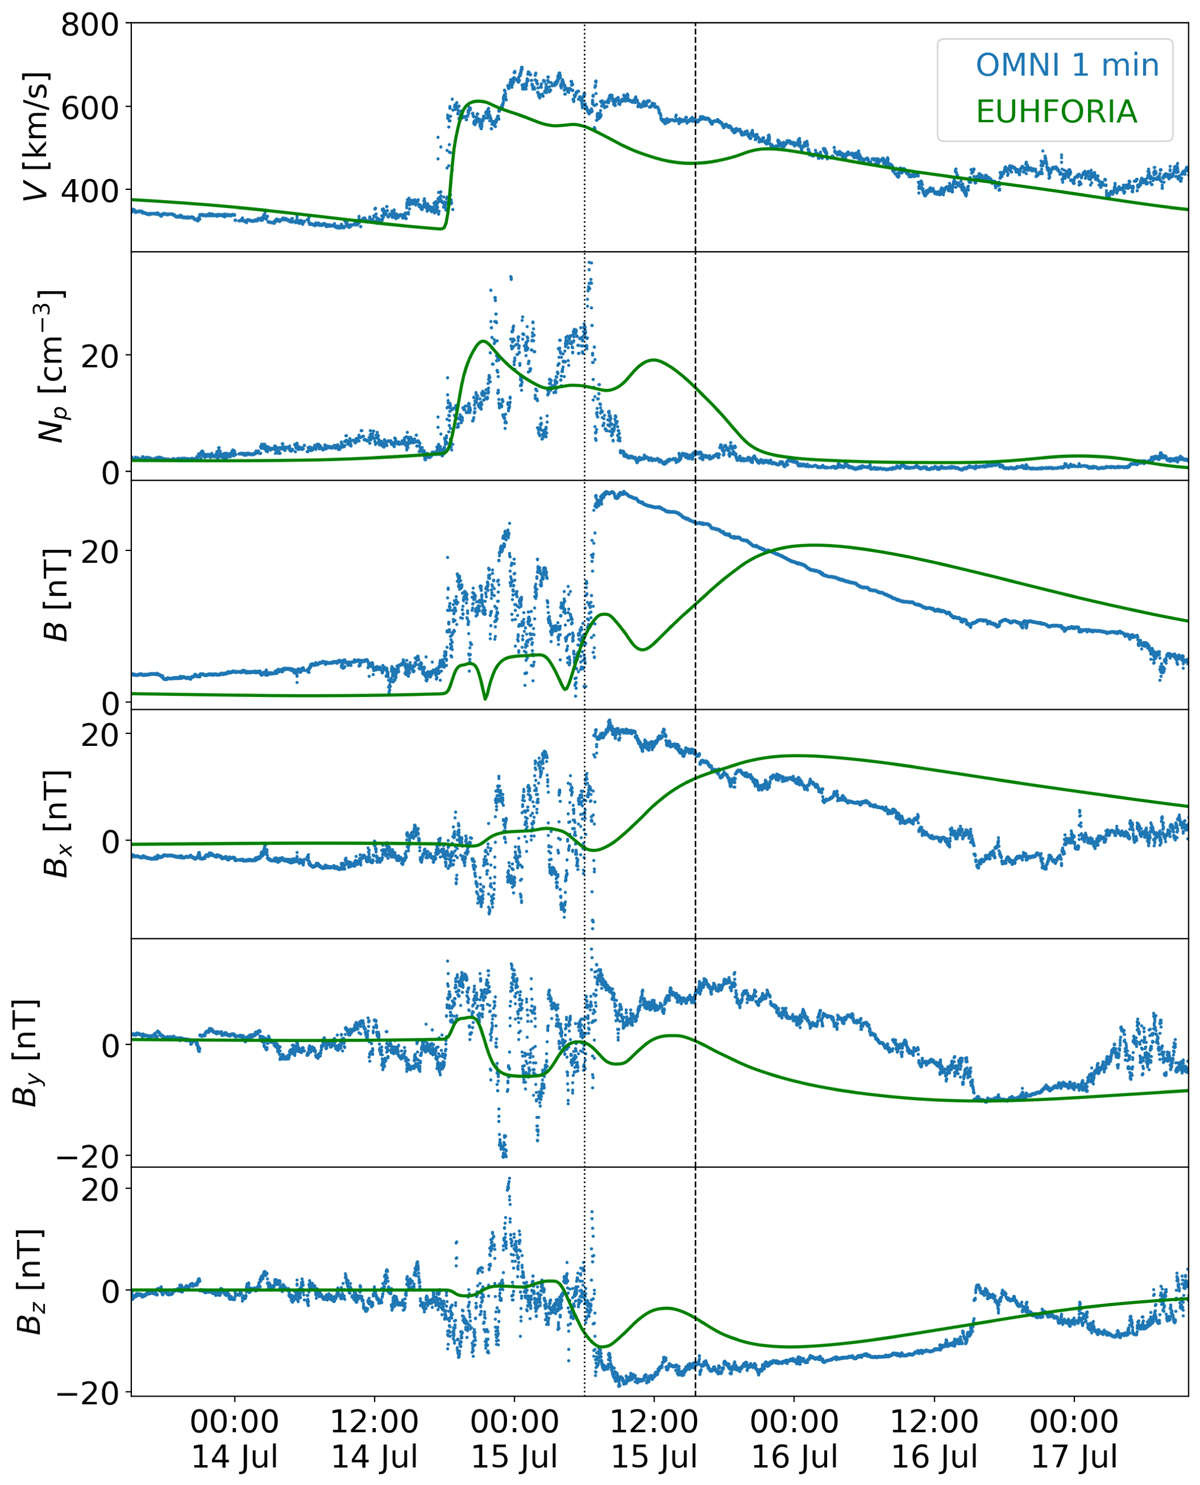
EUHFORIA time series at Earth (green), compared to 1 min OMNI data (blue). From top to bottom: speed, proton number density, magnetic field strength B, and Bx, By, Bz components in GSE coordinates. The vertical lines indicate the onset times of the observed (dotted line) and simulated (dashed line) flux rope.
Current usage metrics show cumulative count of Article Views (full-text article views including HTML views, PDF and ePub downloads, according to the available data) and Abstracts Views on Vision4Press platform.
Data correspond to usage on the plateform after 2015. The current usage metrics is available 48-96 hours after online publication and is updated daily on week days.
Initial download of the metrics may take a while.