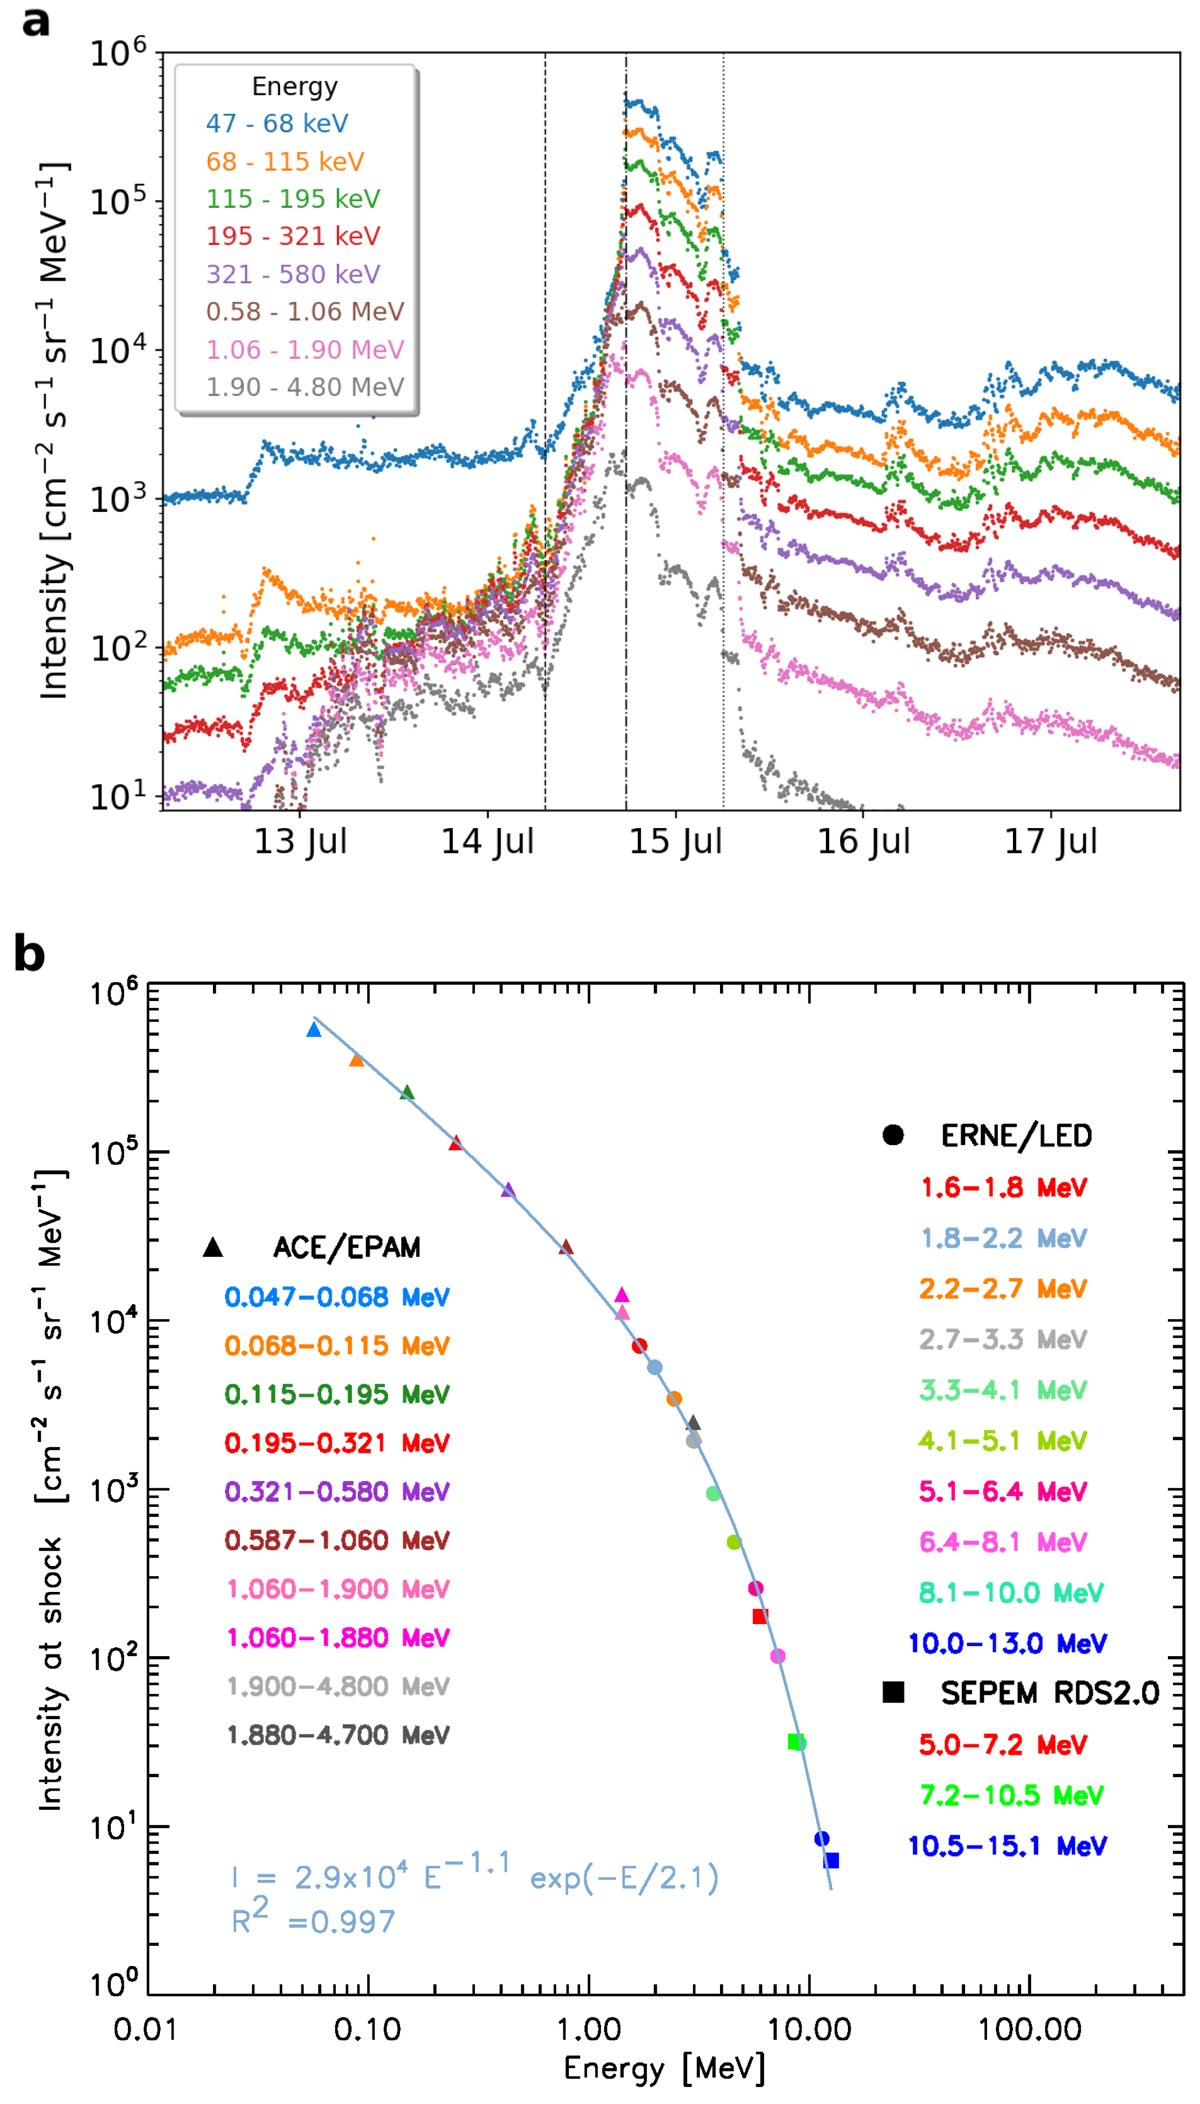
Fig. 1.
Download original image
Ion intensity measurements of the ESP event near Earth. (a) 5-min averages of the ion intensity-time profiles measured by ACE/EPAM for different energy channels. Far from the shock, the lowest energy channel of ACE/EPAM/LEMS120 departs from the nominal energy spectrum due to artificial counts produced by electrons bypassing the magnetic deflection system of LEMS120 (Marhavilas et al. 2015). The vertical lines indicate, from left to right, the onset of the ESP event, the shock arrival, and the leading edge of the flux rope. (b) Energy spectrum of the intensities observed by ACE/EPAM/LEMS120 and LEMS30, observed by ERNE/LED, and extracted from the SEPEM RDS v2.0 at the time of the shock arrival.
Current usage metrics show cumulative count of Article Views (full-text article views including HTML views, PDF and ePub downloads, according to the available data) and Abstracts Views on Vision4Press platform.
Data correspond to usage on the plateform after 2015. The current usage metrics is available 48-96 hours after online publication and is updated daily on week days.
Initial download of the metrics may take a while.