Fig. 5
Download original image
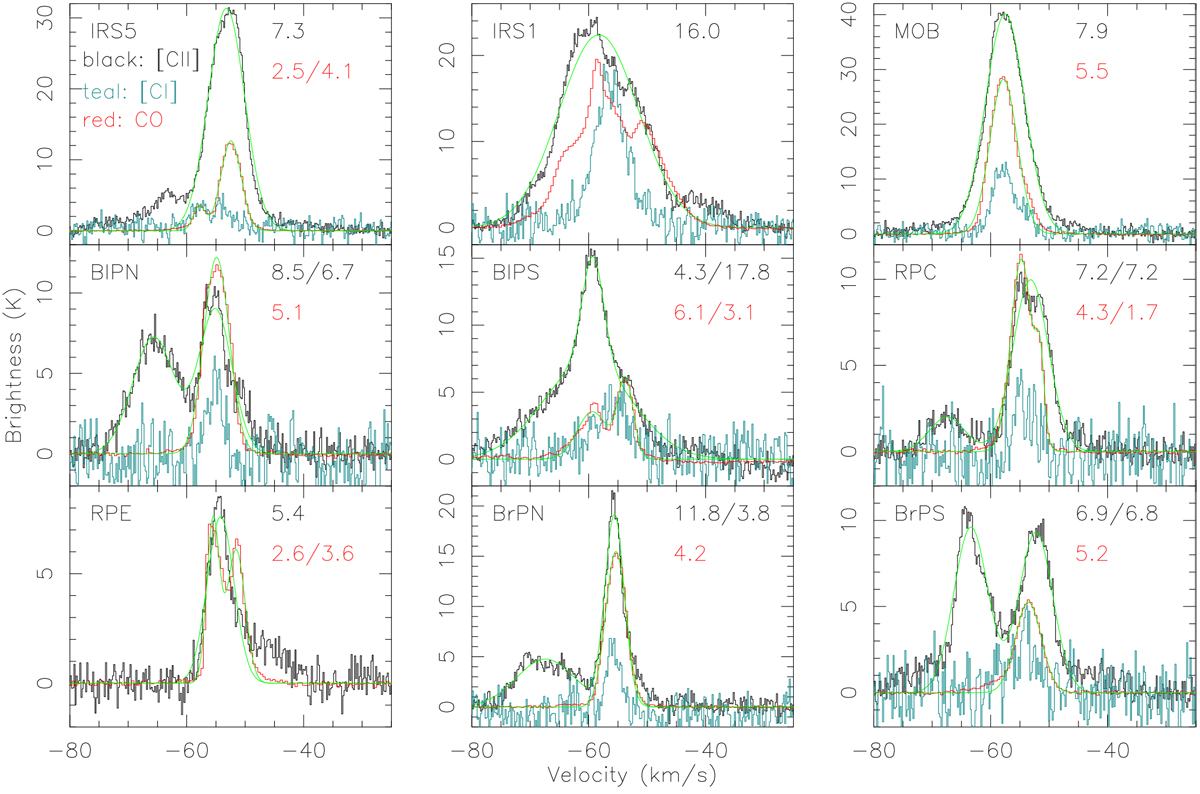
[CII] (black), CO(3–2) (red), and [CI] (teal, multiplied by 2) spectra toward the positions marked in Fig. 4. The green lines show Gaussian fits to the [CII] and CO(3–2) data. The numbers present the corresponding FWHM values (“*/*” labels two components). The positions are labeled in each panel. The RPE position to the east is not covered by the [CI] map.
Current usage metrics show cumulative count of Article Views (full-text article views including HTML views, PDF and ePub downloads, according to the available data) and Abstracts Views on Vision4Press platform.
Data correspond to usage on the plateform after 2015. The current usage metrics is available 48-96 hours after online publication and is updated daily on week days.
Initial download of the metrics may take a while.