Fig. 4
Download original image
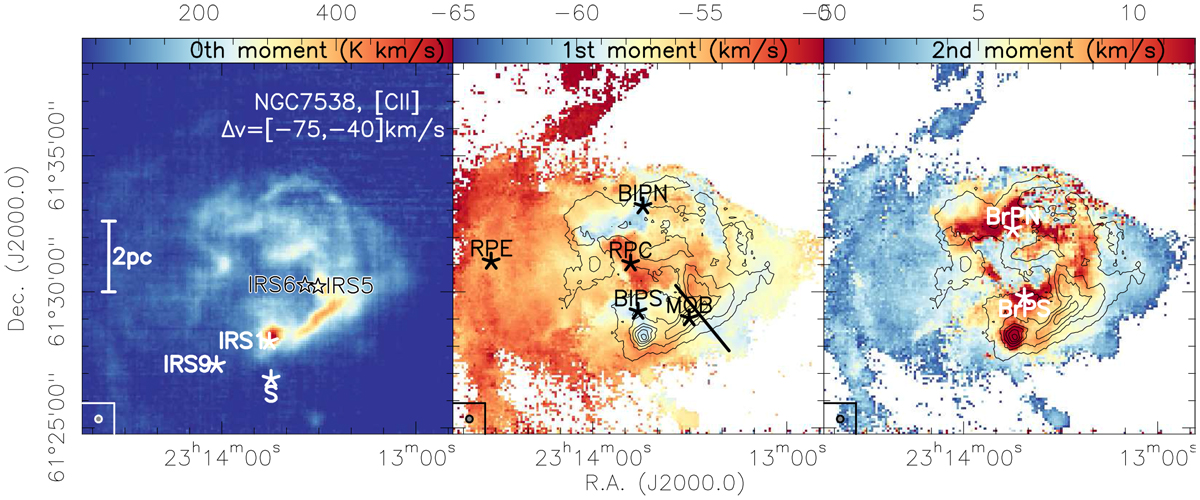
Moment maps of the [CII] emission. Left, middle, and right panels: present (in color scale) the integrated emission and the first- and second-moment maps (intensity-weighted peak velocities and intensity-weighted velocity dispersion) in the velocity range from −75 to −40 km s−1, respectively.The noisier top-right quarters of the first- and second-moment maps are blanked (see Sect. 2). The contours in the middle and right panels show the integrated [CII] emission from the left panel at only a few selected contour levels to highlight similarities and differences. The three five-pointed stars in the left panel mark the positions of the embedded sources NGC 7538IRS1, NGC 7538S, and NGC 7538IRS9. The two stars show the positions of the two main exciting sources of the H II region NGC 7538IRS5 and NGC 7538IRS6. A linear scale bar is presented in the left panel. The markers in the middle and right panels highlight additional positions (see main text) around the areas where we extracted spectra in Fig. 5. The line in the middle panel outlines the pv-cut from IRS6 through the bar-like structure presented in Fig. 13.
Current usage metrics show cumulative count of Article Views (full-text article views including HTML views, PDF and ePub downloads, according to the available data) and Abstracts Views on Vision4Press platform.
Data correspond to usage on the plateform after 2015. The current usage metrics is available 48-96 hours after online publication and is updated daily on week days.
Initial download of the metrics may take a while.