Fig. 3
Download original image
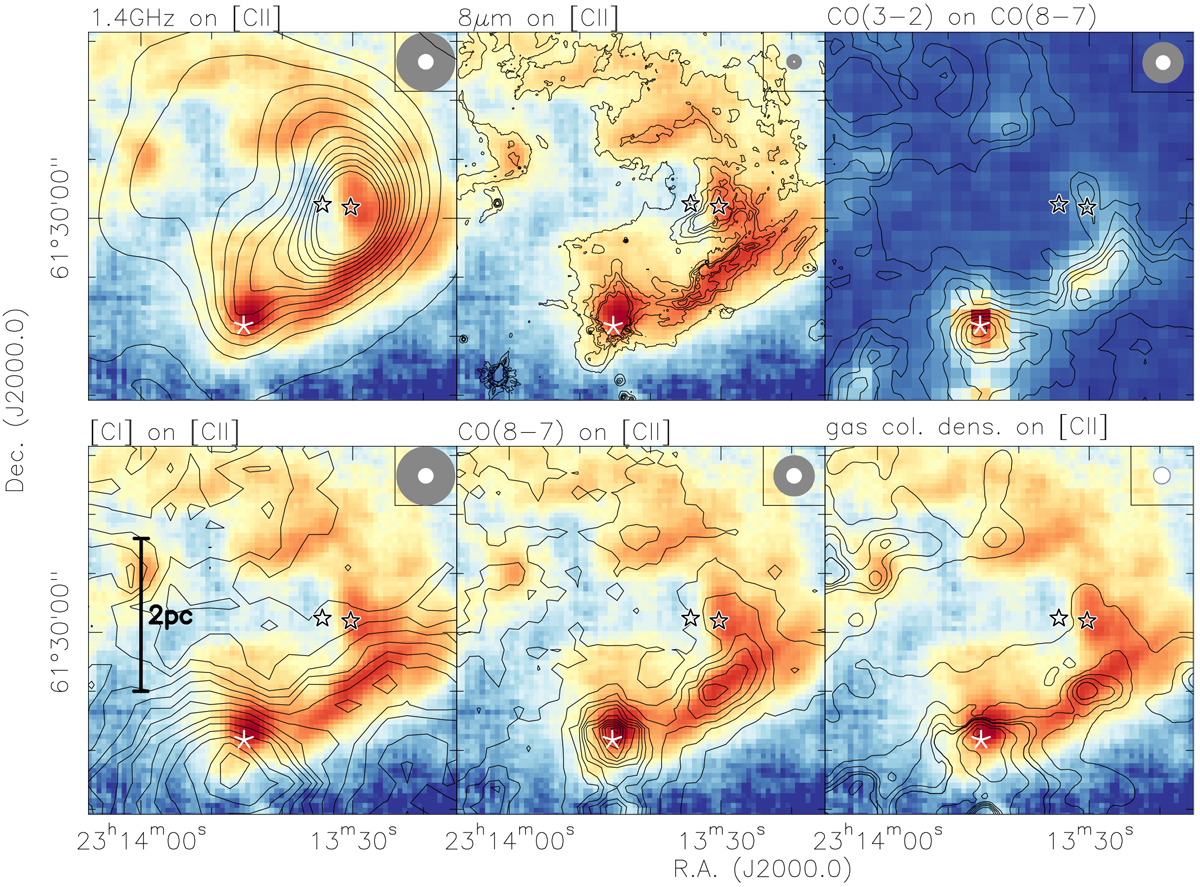
Overlays of selected pairs of emission tracers as described above each panel. The integration ranges for the atomic and molecular lines are the same as in Fig. 2. The contour levels are chosen individually for each figure to highlight the emission best. The angular resolution elements for both tracers are presented in the top-right of each panel. The five-pointed stars always mark the position of the embedded source NGC 7538IRS1 and the two open stars show the positions of the two main exciting sources of the H II region NGC 7538IRS5 and NGC 7538IRS6. A linear scale bar is presented in the bottom-left panel.
Current usage metrics show cumulative count of Article Views (full-text article views including HTML views, PDF and ePub downloads, according to the available data) and Abstracts Views on Vision4Press platform.
Data correspond to usage on the plateform after 2015. The current usage metrics is available 48-96 hours after online publication and is updated daily on week days.
Initial download of the metrics may take a while.