Fig. B.4
Download original image
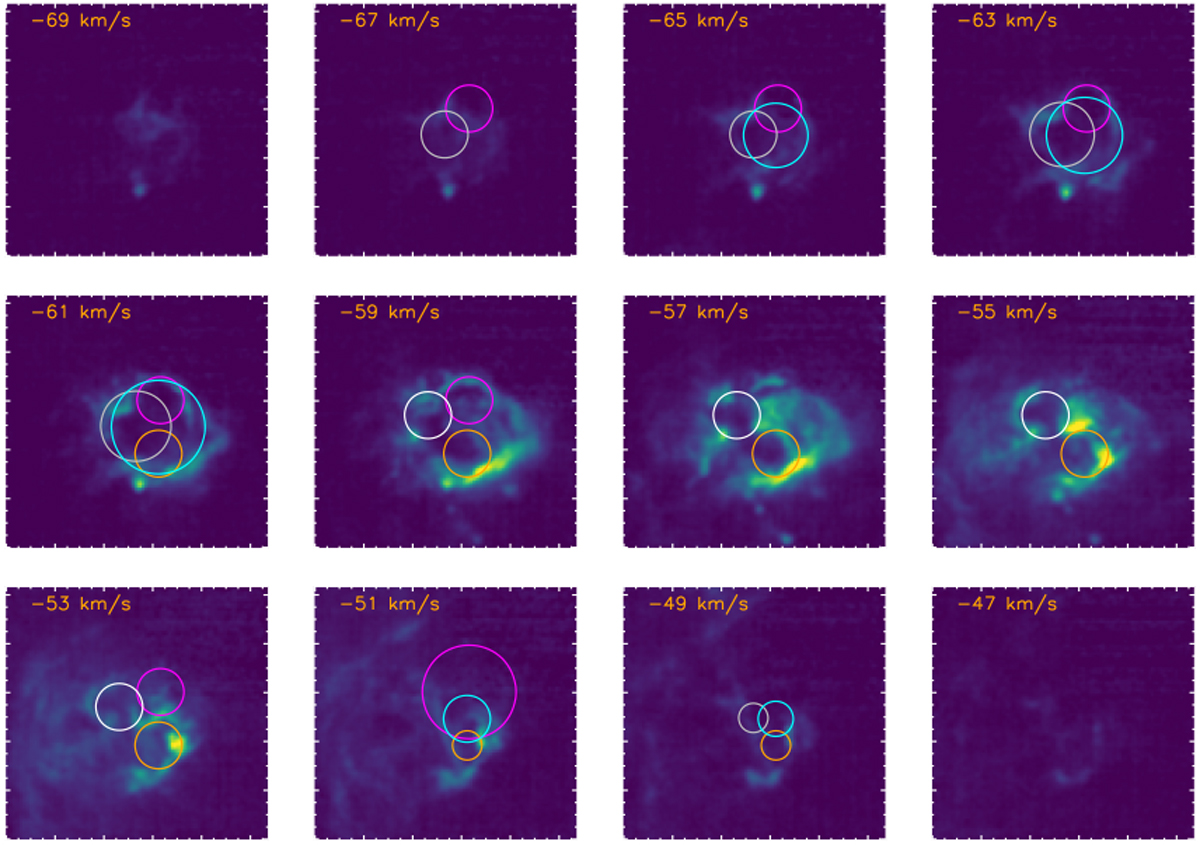
[CII] channel map with an overlay of the identified rings around the five candidate positions from Fig. B.3. The ring radii vary with velocity. The plotted rings are narrower than the rings used in the convolution. Different ring positions are encoded in a different ring color. The positions in panels 1–5 from Fig. B.3 correspond to the colors magenta (A), orange (B), grey (C), white (D), and cyan (E).
Current usage metrics show cumulative count of Article Views (full-text article views including HTML views, PDF and ePub downloads, according to the available data) and Abstracts Views on Vision4Press platform.
Data correspond to usage on the plateform after 2015. The current usage metrics is available 48-96 hours after online publication and is updated daily on week days.
Initial download of the metrics may take a while.